Consumer Discretionary › HOUSEHOLD APPLIANCES

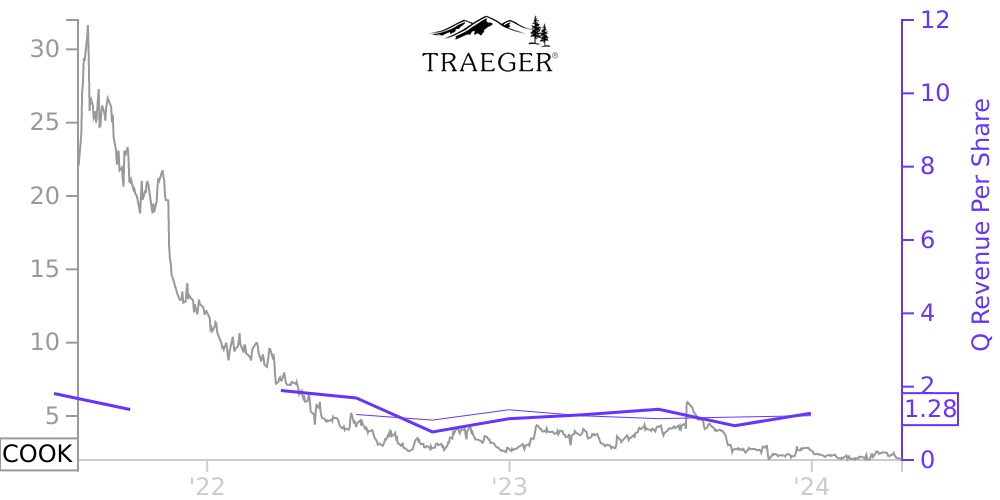
COOK Stock Price Correlated With Traeger Financials
External Links ⌄
Income Statement
Cash Flow
Balance Sheet
COOK Income Statement
Enable JavaScript and reload
Revenue, Net:
Cost of Goods & Services Sold:
Gross Profit:
Selling, General & Admin Expense:
Research & Development Expense:
Total Operating Expenses:
Operating Income:
Income Taxes:
Net Income:
COOK Cash Flow
Enable JavaScript and reload
Operating Activities Net Income:
Depreciation, Depletion & Amortization:
Change in Accounts Receiveable:
Net Cash from Operations:
Repurchases/Buybacks Common Stock:
Issuance of Long-term Debt:
Cash Dividends Paid:
Net Cash from Financing Activities:
Property, Plant & Equipment Purchases:
Purchases of Businesses, Net of Cash:
Net Cash from Investing Activities:
Net Change in Cash & Equivalents:
COOK Balance Sheet
Enable JavaScript and reload
Cash and Cash Equivalents:
Short-Term Investments:
Accounts Receivable, Net:
Inventories:
Total Current Assets:
Property, Plant & Equipment, Net:
Total Assets:
Accounts Payable:
Current Portion of Long-Term Debt:
Total Short-Term Liabilities:
Long Term Debt, Non-Current Portion:
Total Long-Term Liabilities:
Total Liabilities:
COMPANY PROFILE
DESCRIPTION OF BUSINESS AND BASIS OF PRESENTATION Nature of Operations – Traeger, Inc. and its wholly owned Subsidiaries (collectively "Traeger" or the "Company") design, source, sell, and support wood pellet fueled barbecue grills sold to retailers, distributors, and direct to consumers. The Company produces and sells the pellets used to fire the grills and also sells Traeger-branded rubs, spices, sauces and premium frozen meal kits, as well as grill accessories (including covers, barbecue tools, trays, liners, MEATER smart thermometers and merchandise). A significant portion of the Company’s sales are generated from customers throughout the United States ("U.S."), and the Company continues to develop distribution in Canada and Europe. The Company’s headquarters are in Salt Lake City, Utah.
In July 2021, the Company effected a forward split of its 10 common units into 108,724,422 common units. All unit, per unit and related information presented in the accompanying consolidated financial statements have been retroactively adjusted, where applicable, to reflect the impact of the split of common units.
Immediately prior to the effectiveness of the registration statement pertaining to the Company’s initial public offering ("IPO") on July 28, 2021, the Company converted from a Delaware limited liability company into a Delaware corporation, and changed its name from TGPX Holdings I LLC to Traeger, Inc. Pursuant to the statutory corporate conversion (the "Corporate Conversion"), all of the outstanding limited liability company interests of TGPX Holdings I LLC were converted into shares of common stock of Traeger, Inc., and TGP Holdings LP (the "Partnership") became the holder of such shares of common stock of Traeger, Inc. In connection with the Corporate Conversion, the Partnership liquidated and distributed these shares of common stock to the holders of partnership interests in the Partnership in direct proportion to their respective interests in the Partnership based upon the value of Traeger, Inc. at the time of the IPO, with a value implied by the initial public offering price of the shares of common stock sold in the IPO. Based on the IPO price of $18.00 per share, following the Partnership’s liquidation and distribution, including the elimination of any fractional shares resulting therefrom, and the Corporate Conversion, the Company had 108,724,387 shares of common stock outstanding immediately prior to the IPO.
Basis of Presentation and Principles of Consolidation – The accompanying unaudited condensed consolidated financial statements have been prepared in accordance with accounting principles generally accepted in the United States of America ("U.S. GAAP"). The accompanying unaudited condensed consolidated financial statements include the accounts of the Company and its wholly owned subsidiaries. All intercompany balances and transactions have been eliminated in consolidation.
The balance sheet as of December 31, 2021 has been derived from the audited consolidated financial statements at that date but does not include all information and footnotes required by U.S. GAAP for complete financial statements. These unaudited condensed consolidated financial statements should be read in conjunction with the Company's audited consolidated financial statements for the year ended December 31, 2021 included in the Company’s Annual Report on Form 10-K , filed with the Securities and Exchange Commission on March 29, 2022 (the "Annual Report on Form 10-K").
In the opinion of management, the accompanying unaudited condensed consolidated financial statements contain all normal and recurring adjustments necessary to fairly present the consolidated financial position, results of operations and cash flows for the interim periods presented. Operating results for the three months ended March 31, 2022 are not necessarily indicative of results that may be expected for any other interim period or for the year ended December 31, 2022.
The a
Free historical financial statements for Traeger Inc.. See how revenue, income, cash flow, and balance sheet financials have changed over 20 quarters since 2021. Compare with COOK stock chart to see long term trends.
Data imported from Traeger Inc. SEC filings. Check original filings before making any investment decision.