Technology › Computer Communications Equipment

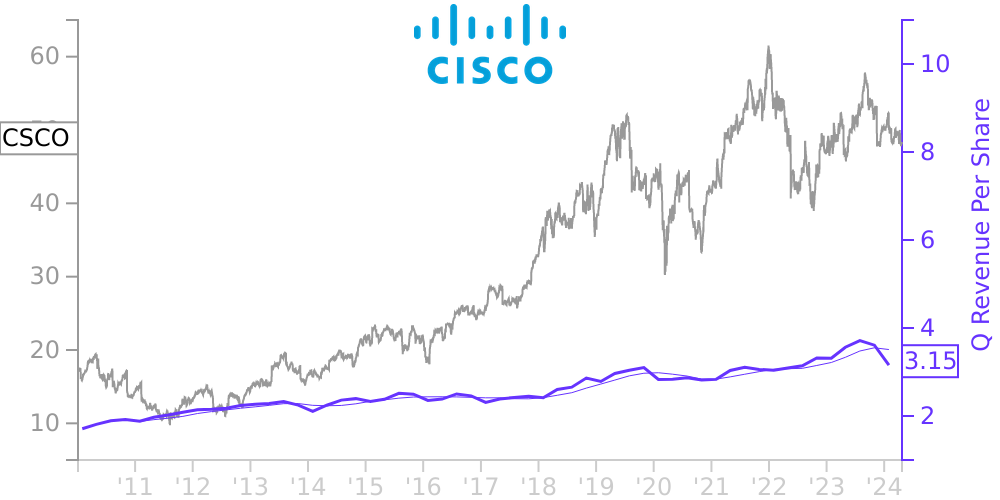
CSCO Stock Price Correlated With Cisco Systems Financials
External Links ⌄
Income Statement
Cash Flow
Balance Sheet
CSCO Income Statement
Enable JavaScript and reload
Revenue, Net:
Cost of Goods & Services Sold:
Gross Profit:
Selling, General & Admin Expense:
Research & Development Expense:
Total Operating Expenses:
Operating Income:
Income Taxes:
Net Income:
CSCO Cash Flow
Enable JavaScript and reload
Operating Activities Net Income:
Depreciation, Depletion & Amortization:
Change in Accounts Receiveable:
Net Cash from Operations:
Repurchases/Buybacks Common Stock:
Issuance of Long-term Debt:
Cash Dividends Paid:
Net Cash from Financing Activities:
Property, Plant & Equipment Purchases:
Purchases of Businesses, Net of Cash:
Net Cash from Investing Activities:
Net Change in Cash & Equivalents:
CSCO Balance Sheet
Enable JavaScript and reload
Cash and Cash Equivalents:
Short-Term Investments:
Accounts Receivable, Net:
Inventories:
Total Current Assets:
Property, Plant & Equipment, Net:
Total Assets:
Accounts Payable:
Current Portion of Long-Term Debt:
Total Short-Term Liabilities:
Long Term Debt, Non-Current Portion:
Total Long-Term Liabilities:
Total Liabilities:
COMPANY PROFILE
Cisco Systems, Inc. engages in the design, manufacture, and sale of Internet Protocol-based networking products and services related to the communications and information technology industry. The firm operates through the following geographical segments: the Americas, EMEA, and APJC. Its products include the following categories: Switches, Routers, Wireless, Network Management Interfaces and Modules, Optical Networking, Access Points, Outdoor and Industrial Access Points, Next-Generation Firewalls, Advanced Malware Protection, VPN Security Clients, Email, and Web Security.
Free historical financial statements for Cisco Systems Inc. See how revenue, income, cash flow, and balance sheet financials have changed over 67 quarters since 2009. Compare with CSCO stock chart to see long term trends.
Data imported from Cisco Systems Inc SEC filings. Check original filings before making any investment decision.