Industrials › Railroads, Line-Haul Operating

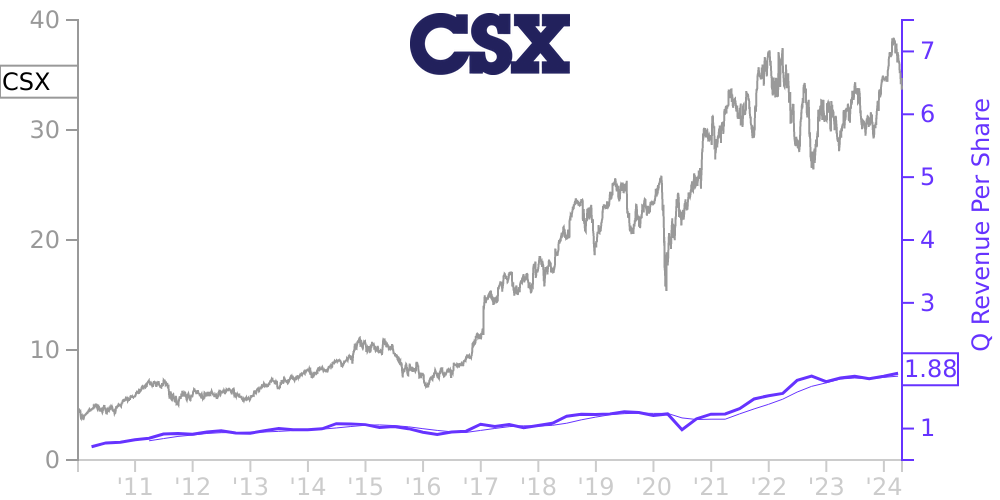
CSX Stock Price Correlated With CSX Financials
External Links ⌄
Income Statement
Cash Flow
Balance Sheet
CSX Income Statement
Enable JavaScript and reload
Revenue, Net:
Cost of Goods & Services Sold:
Gross Profit:
Selling, General & Admin Expense:
Research & Development Expense:
Total Operating Expenses:
Operating Income:
Income Taxes:
Net Income:
CSX Cash Flow
Enable JavaScript and reload
Operating Activities Net Income:
Depreciation, Depletion & Amortization:
Change in Accounts Receiveable:
Net Cash from Operations:
Repurchases/Buybacks Common Stock:
Issuance of Long-term Debt:
Cash Dividends Paid:
Net Cash from Financing Activities:
Property, Plant & Equipment Purchases:
Purchases of Businesses, Net of Cash:
Net Cash from Investing Activities:
Net Change in Cash & Equivalents:
CSX Balance Sheet
Enable JavaScript and reload
Cash and Cash Equivalents:
Short-Term Investments:
Accounts Receivable, Net:
Inventories:
Total Current Assets:
Property, Plant & Equipment, Net:
Total Assets:
Accounts Payable:
Current Portion of Long-Term Debt:
Total Short-Term Liabilities:
Long Term Debt, Non-Current Portion:
Total Long-Term Liabilities:
Total Liabilities:
COMPANY PROFILE
Basis of Presentation
In the opinion of management, the accompanying consolidated financial statements contain all normal, recurring adjustments necessary to present fairly the financial position of CSX and its subsidiaries at December 2010 and December 2009, and the consolidated statements of income, cash flows and changes in shareholders’ equity for fiscal years 2010, 2009 and 2008.
In addition, management has evaluated and disclosed all material events occurring subsequent to the date of the financial statements up to the date this annual report is filed on Form 10-K.
Free historical financial statements for CSX Corp. See how revenue, income, cash flow, and balance sheet financials have changed over 70 quarters since 2009. Compare with CSX stock chart to see long term trends.
Data imported from CSX Corp SEC filings. Check original filings before making any investment decision.