Industrials › Men'S And Boys' Furnishings, Work Clothing, And Allied Garments

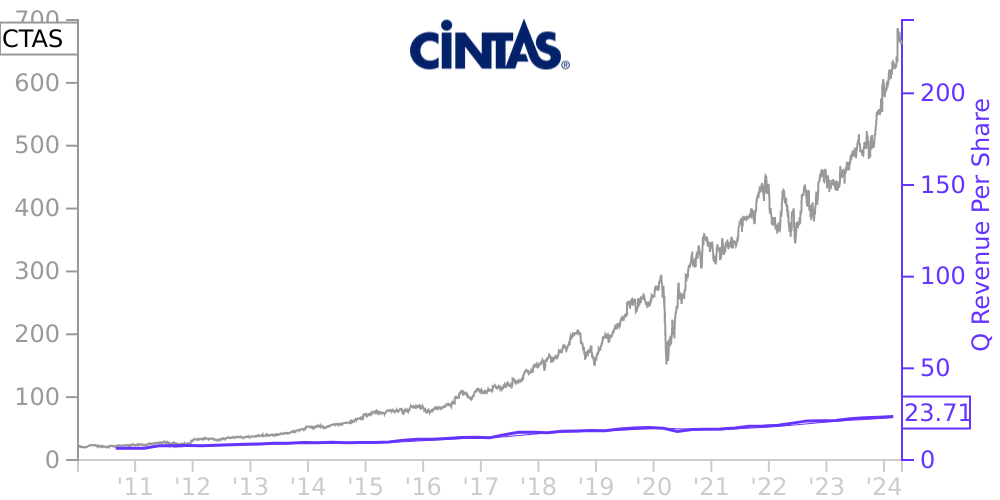
CTAS Stock Price Correlated With Cintas Financials
External Links ⌄
Income Statement
Cash Flow
Balance Sheet
CTAS Income Statement
Enable JavaScript and reload
Revenue, Net:
Cost of Goods & Services Sold:
Gross Profit:
Selling, General & Admin Expense:
Research & Development Expense:
Total Operating Expenses:
Operating Income:
Income Taxes:
Net Income:
CTAS Cash Flow
Enable JavaScript and reload
Operating Activities Net Income:
Depreciation, Depletion & Amortization:
Change in Accounts Receiveable:
Net Cash from Operations:
Repurchases/Buybacks Common Stock:
Issuance of Long-term Debt:
Cash Dividends Paid:
Net Cash from Financing Activities:
Property, Plant & Equipment Purchases:
Purchases of Businesses, Net of Cash:
Net Cash from Investing Activities:
Net Change in Cash & Equivalents:
CTAS Balance Sheet
Enable JavaScript and reload
Cash and Cash Equivalents:
Short-Term Investments:
Accounts Receivable, Net:
Inventories:
Total Current Assets:
Property, Plant & Equipment, Net:
Total Assets:
Accounts Payable:
Current Portion of Long-Term Debt:
Total Short-Term Liabilities:
Long Term Debt, Non-Current Portion:
Total Long-Term Liabilities:
Total Liabilities:
COMPANY PROFILE
Basis of Presentation The consolidated condensed financial statements of Cintas Corporation (Cintas, the Company, we, us or our) included herein have been prepared by Cintas, without audit, pursuant to the rules and regulations of the Securities and Exchange Commission (SEC). Certain information and footnote disclosures normally included in consolidated financial statements prepared in accordance with United States generally accepted accounting principles (U.S. GAAP) have been condensed or omitted pursuant to such rules and regulations. While we believe that the disclosures are adequately presented, we suggest that these consolidated condensed financial statements be read in conjunction with the consolidated financial statements and notes included in our Annual Report on Form 10-K for the fiscal year ended May 31, 2022 filed with the SEC on July 27, 2022. A summary of our significant accounting policies is presented beginning on page 41 of that report. There have been no material changes in the accounting policies followed by Cintas during the current fiscal year.
Interim results are subject to variations and are not necessarily indicative of the results of operations for a full fiscal year. In the opinion of management, adjustments (which include only normal recurring adjustments) necessary for a fair statement of the consolidated results of the interim periods shown have been made.
Inventories, net are valued at the lower of cost (first-in, first-out) or net realizable value. Inventory is comprised of the following:
(In thousands) August 31, 2022 May 31, 2022 Raw materials $ 25,728 $ 19,071 Work in process 34,310 34,280 Finished goods 413,850 418,799 $ 473,888 $ 472,150
Inventories are recorded net of reserves for obsolete inventory (excess and slow-moving) of $89.1 million and $100.3 million at August 31, 2022 and May 31, 2022, respectively. The inventory obsolescence reserve is determined by specific identification, as well as an estimate based on Cintas' historical rates of obsolescence. Once a specific inventory item is written down to the lower of cost or net realizable value, a new cost basis has been established, and that inventory item cannot subsequently be marked up.
New Accounting Pronouncements
There are no new accounting pronouncements recently issued or newly effective that had, or are expected to have, a material impact on Cintas' consolidated condensed financial statements.
Free historical financial statements for Cintas Corp. See how revenue, income, cash flow, and balance sheet financials have changed over 63 quarters since 2010. Compare with CTAS stock chart to see long term trends.
Data imported from Cintas Corp SEC filings. Check original filings before making any investment decision.