Consumer Discretionary › Hotels And Motels

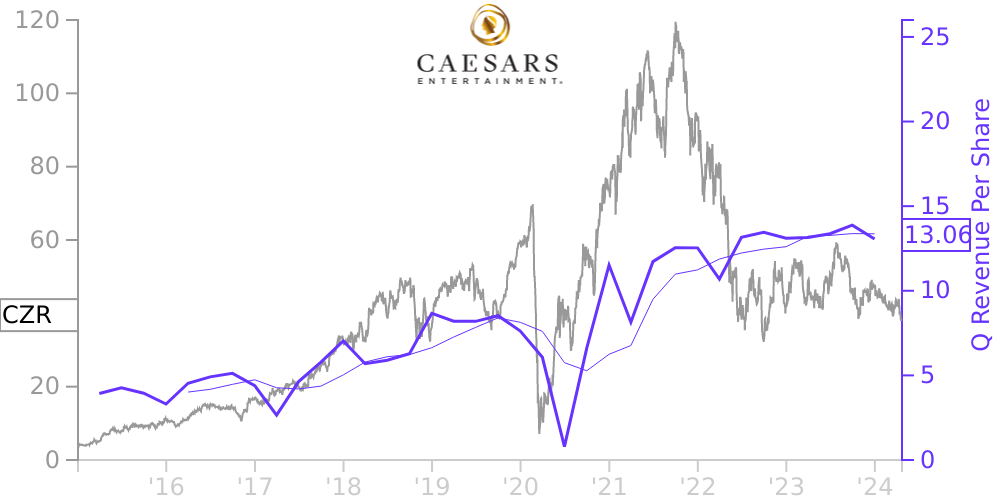
CZR Stock Price Correlated With Caesars Entertainment Financials
External Links ⌄
Income Statement
Cash Flow
Balance Sheet
CZR Income Statement
Enable JavaScript and reload
Revenue, Net:
Cost of Goods & Services Sold:
Gross Profit:
Selling, General & Admin Expense:
Research & Development Expense:
Total Operating Expenses:
Operating Income:
Income Taxes:
Net Income:
CZR Cash Flow
Enable JavaScript and reload
Operating Activities Net Income:
Depreciation, Depletion & Amortization:
Change in Accounts Receiveable:
Net Cash from Operations:
Repurchases/Buybacks Common Stock:
Issuance of Long-term Debt:
Cash Dividends Paid:
Net Cash from Financing Activities:
Property, Plant & Equipment Purchases:
Purchases of Businesses, Net of Cash:
Net Cash from Investing Activities:
Net Change in Cash & Equivalents:
CZR Balance Sheet
Enable JavaScript and reload
Cash and Cash Equivalents:
Short-Term Investments:
Accounts Receivable, Net:
Inventories:
Total Current Assets:
Property, Plant & Equipment, Net:
Total Assets:
Accounts Payable:
Current Portion of Long-Term Debt:
Total Short-Term Liabilities:
Long Term Debt, Non-Current Portion:
Total Long-Term Liabilities:
Total Liabilities:
COMPANY PROFILE
Organization and Basis of Presentation Organization
The Company is a geographically diversified gaming and hospitality company that was founded in 1973 by the Carano family with the opening of the Eldorado Hotel Casino in Reno, Nevada. Beginning in 2005, grew through a series of acquisitions, including the acquisition of MTR Gaming Group, Inc. in 2014, Isle of Capri Casinos, Inc. (“Isle” or “Isle of Capri”) in 2017 and Tropicana Entertainment, Inc. in 2018. On July 20, 2020, the Company completed the merger with Caesars Entertainment Corporation (“Former Caesars”) pursuant to which Former Caesars became a wholly-owned subsidiary of the Company (the “Merger”) and the Company changed the Company’s ticker symbol on the NASDAQ Stock Market from “ERI” to “CZR”.
On April 22, 2021, the Company completed the acquisition of William Hill PLC for £2.9 billion, or approximately $3.9 billion (the “William Hill Acquisition”). See below for further discussion of the William Hill Acquisition.
The Company owns, leases, brands or manages an aggregate of 52 domestic properties in 16 states with approximately 55,700 slot machines, video lottery terminals and e-tables, approximately 2,900 table games and approximately 47,700 hotel rooms as of December 31, 2021. The Company operates and conducts sports wagering across 21 states and domestic jurisdictions, 14 of which are mobile for sports betting, and operates regulated online real money gaming businesses in five states. In addition, we have other domestic and international properties that are authorized to use the brands and marks of Caesars Entertainment, Inc., as well as other non-gaming properties. The Company’s primary source of revenue is generated by our casino properties’ gaming operations, retail and online sports betting, as well as online gaming, and the Company utilizes its hotels, restaurants, bars, entertainment, racing, retail shops and other services to attract customers to its properties.
The Company’s operations for retail and mobile sports betting, online casino, and online poker are included under the Caesars Digital segment. The Company has made significant investments into the interactive business with the completion of the Merger and the William Hill Acquisition. The Company has launched a significant marketing campaign with distinguished actors, athletes and media personalities promoting the launch of the Caesars Sportsbook app. The app offers numerous pre-match and live markets, extensive odds and flexible limits, player props, and same-game parlays. Caesars Sportsbook has partnerships with the NFL, NBA, NHL and MLB while being the exclusive odds provider for ESPN and CBS Sports. The Company also expects to continue to create new partnerships among collegiate and professional sports teams and recently entered into the exclusive naming-rights partnership that rebranded the Caesars Superdome. The Company expects to continue to expand its operations in the Caesars Digital segment as new jurisdictions legalize retail and online sports betting.
The Company has divested certain properties and other assets, including non-core properties and divestitures required by regulatory agencies. See Note 4 for a discussion of properties recently sold or currently held for sale and Note 19 for segment information.
William Hill Acquisition
On September 30, 2020, the Company announced that it had reached an agreement with William Hill PLC on the terms of a recommended cash acquisition pursuant to which the Company would acquire the entire issued and to be issued share capital (other than shares owned by the Company or held in treasury) of William Hill PLC, in an all-cash transaction. On April 22, 2021, the Company completed the acquisition of William Hill PLC for £2.9 billion, or approximately $3.9 billion . See Note 3.
In connection with the William Hill Acquisition, on April 22, 2021, a newly formed subsidiary of the Company (the “Bridge Facility Borrower”) entered into a Credit Agre
Free historical financial statements for Caesars Entertainment Inc.. See how revenue, income, cash flow, and balance sheet financials have changed over 45 quarters since 2015. Compare with CZR stock chart to see long term trends.
Data imported from Caesars Entertainment Inc. SEC filings. Check original filings before making any investment decision.