Consumer Discretionary › Operative Builders

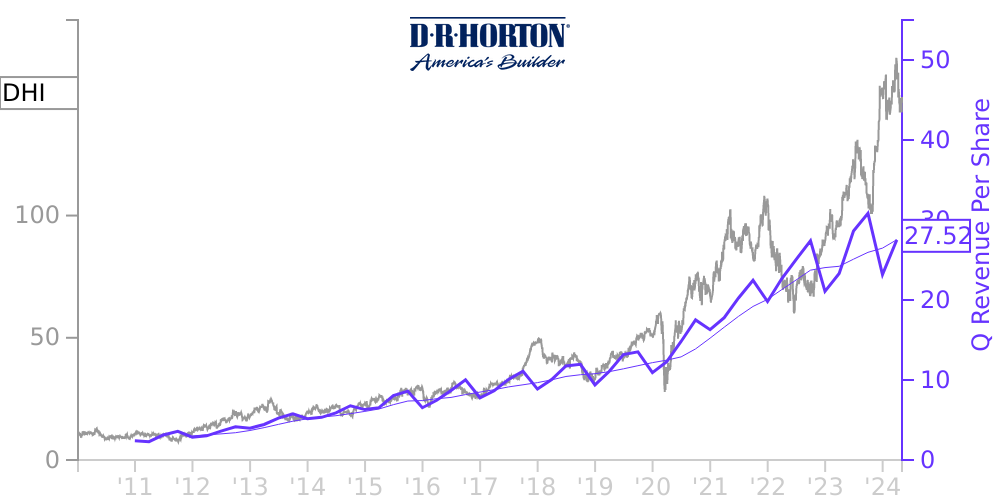
DHI Stock Price Correlated With DR Horton Financials
External Links ⌄
Income Statement
Cash Flow
Balance Sheet
DHI Income Statement
Enable JavaScript and reload
Revenue, Net:
Cost of Goods & Services Sold:
Gross Profit:
Selling, General & Admin Expense:
Research & Development Expense:
Total Operating Expenses:
Operating Income:
Income Taxes:
Net Income:
DHI Cash Flow
Enable JavaScript and reload
Operating Activities Net Income:
Depreciation, Depletion & Amortization:
Change in Accounts Receiveable:
Net Cash from Operations:
Repurchases/Buybacks Common Stock:
Issuance of Long-term Debt:
Cash Dividends Paid:
Net Cash from Financing Activities:
Property, Plant & Equipment Purchases:
Purchases of Businesses, Net of Cash:
Net Cash from Investing Activities:
Net Change in Cash & Equivalents:
DHI Balance Sheet
Enable JavaScript and reload
Cash and Cash Equivalents:
Short-Term Investments:
Accounts Receivable, Net:
Inventories:
Total Current Assets:
Property, Plant & Equipment, Net:
Total Assets:
Accounts Payable:
Current Portion of Long-Term Debt:
Total Short-Term Liabilities:
Long Term Debt, Non-Current Portion:
Total Long-Term Liabilities:
Total Liabilities:
COMPANY PROFILE
NOTE A – BASIS OF PRESENTATION
The accompanying unaudited, consolidated financial statements include the accounts of D.R.
Horton, Inc. and all of its wholly-owned, majority-owned and controlled subsidiaries (which are
referred to as the Company, unless the context otherwise requires). All significant intercompany
accounts, transactions and balances have been eliminated in consolidation. The financial statements
have been prepared in accordance with U.S. Generally Accepted Accounting Principles (GAAP) for
interim financial information and with the instructions to Form 10-Q and Article 10 of Regulation
S-X. In the opinion of management, all adjustments (consisting of normal, recurring accruals and
the asset impairment charges, loss reserves and deferred tax asset valuation allowance discussed
below) considered necessary for a fair presentation have been included. These financial statements
do not include all of the information and notes required by GAAP for complete financial statements
and should be read in conjunction with the consolidated financial statements and accompanying notes
included in the Company’s annual report on Form 10-K for the fiscal year ended September 30, 2010.
Use of Estimates
The preparation of financial statements in conformity with GAAP requires management to make
estimates and assumptions that affect the amounts reported in the financial statements and
accompanying notes. Actual results could differ materially from those estimates.
Reclassifications
Certain reclassifications have been made in the prior year’s financial statements to conform
to classifications used in the current year. The statement of operations for the three and nine
months ended June 30, 2010 has been revised to reflect the reclassification of depreciation expense
related to rental properties of $0.3 million and $0.9 million, respectively, from homebuilding
other income to selling, general and administrative expense. Additionally, the statement of cash
flows for the nine months ended June 30, 2010 has been revised to reflect this reclassification.
Business
The Company is a national homebuilder that is engaged in the construction and sale of
single-family housing in 71 markets and 26 states in the United States as of June 30, 2011. The
Company designs, builds and sells single-family detached homes on lots it develops and on finished
lots purchased ready for home construction. To a lesser extent, the Company also builds and sells
attached homes, such as town homes, duplexes, triplexes and condominiums (including some mid-rise
buildings), which share common walls and roofs. Periodically, the Company sells land and lots. The
Company also provides title agency and mortgage financing services, primarily to its homebuyers.
The Company generally does not retain or service the mortgages that it originates; rather, it seeks
to sell the mortgages and related servicing rights to third-party purchasers.
Seasonality
Historically, the homebuilding industry has experienced seasonal fluctuations; therefore, the
operating results for the three and nine-month periods ended June 30, 2011 are not necessarily
indicative of the results that may be expected for the fiscal year ending September 30, 2011 or
subsequent periods.
Free historical financial statements for DR Horton Inc.. See how revenue, income, cash flow, and balance sheet financials have changed over 63 quarters since 2010. Compare with DHI stock chart to see long term trends.
Data imported from DR Horton Inc. SEC filings. Check original filings before making any investment decision.