
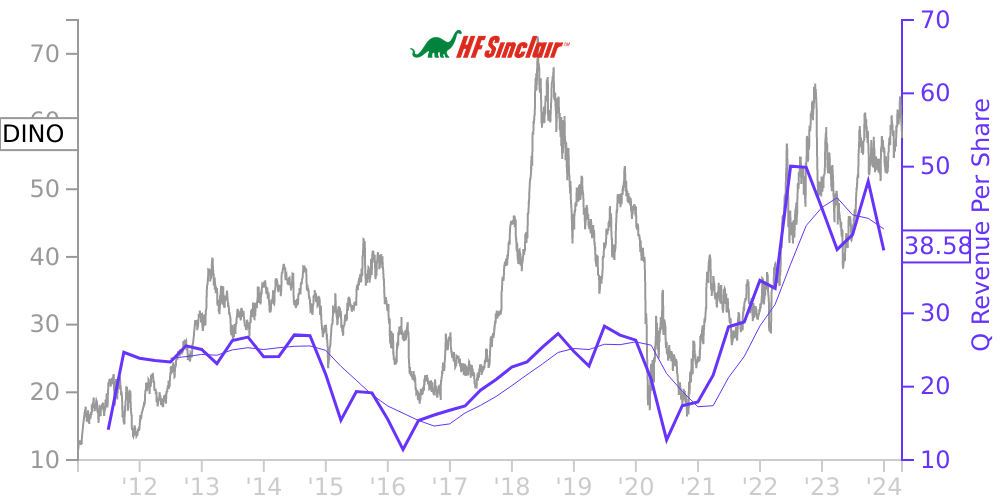
DINO Stock Price Correlated With HF Sinclair Financials
External Links ⌄
Income Statement
Cash Flow
Balance Sheet
DINO Income Statement
Enable JavaScript and reload
Revenue, Net:
Cost of Goods & Services Sold:
Gross Profit:
Selling, General & Admin Expense:
Research & Development Expense:
Total Operating Expenses:
Operating Income:
Income Taxes:
Net Income:
DINO Cash Flow
Enable JavaScript and reload
Operating Activities Net Income:
Depreciation, Depletion & Amortization:
Change in Accounts Receiveable:
Net Cash from Operations:
Repurchases/Buybacks Common Stock:
Issuance of Long-term Debt:
Cash Dividends Paid:
Net Cash from Financing Activities:
Property, Plant & Equipment Purchases:
Purchases of Businesses, Net of Cash:
Net Cash from Investing Activities:
Net Change in Cash & Equivalents:
DINO Balance Sheet
Enable JavaScript and reload
Cash and Cash Equivalents:
Short-Term Investments:
Accounts Receivable, Net:
Inventories:
Total Current Assets:
Property, Plant & Equipment, Net:
Total Assets:
Accounts Payable:
Current Portion of Long-Term Debt:
Total Short-Term Liabilities:
Long Term Debt, Non-Current Portion:
Total Long-Term Liabilities:
Total Liabilities:
COMPANY PROFILE
HF Sinclair ("we") is an independent petroleum refiner and marketer that produces high-value light products such as gasoline, diesel fuel, jet fuel, specialty lubricant products and specialty and modified asphalt. As of December 31, 2021, we owned and operated petroleum refineries located in Kansas, Oklahoma, New Mexico, Utah and Washington, and we market our refined products principally in the Southwest United States, the Rocky Mountains extending into the Pacific Northwest and in other neighboring Plains states. In addition, we produce base oils and other specialized lubricants in the United States, Canada and the Netherlands, with retail and wholesale marketing of our products through a global sales network with locations in Canada, the United States, Europe, China and Latin America. We also own a 57% limited partner interest and a non-economic general partner interest in HEP, a variable interest entity (“VIE”). HEP owns and operates logistic assets consisting of petroleum product and crude oil pipelines, terminals, tankage, loading rack facilities and refinery processing units that principally support our refining and marketing operations in the Mid-Continent, Southwest and Rocky Mountains geographic regions of the United States.
On August 2, 2021, HollyFrontier, Hippo Parent Corporation, a wholly owned subsidiary of HollyFrontier (“New Parent”), Hippo Merger Sub, Inc., a wholly owned subsidiary of New Parent, The Sinclair Companies (“Sinclair”), and Hippo Holding LLC, a wholly owned subsidiary of Sinclair (the “Target Company”), entered into a business combination agreement, pursuant to which HollyFrontier will acquire the Target Company.
On May 4, 2021, HollyFrontier Puget Sound Refining LLC, a wholly owned subsidiary of HollyFrontier Corporation, entered into a sale and purchase agreement with Equilon Enterprises LLC d/b/a Shell Oil Products US (“Shell”) to acquire Shell’s Puget Sound refinery and related assets, including the on-site cogeneration facility and related logistics assets (the “Puget Sound Refinery”). The acquisition closed on November 1, 2021.
On November 12, 2018, we entered into an equity purchase agreement to acquire 100% of the issued and outstanding capital stock of Sonneborn US Holdings Inc. and 100% of the membership rights in Sonneborn Coöperatief U.A. (collectively, “Sonneborn”). The acquisition closed on February 1, 2019.
Free historical financial statements for HF Sinclair Corp. See how revenue, income, cash flow, and balance sheet financials have changed over 60 quarters since 2011. Compare with DINO stock chart to see long term trends.
Data imported from HF Sinclair Corp SEC filings. Check original filings before making any investment decision.