Technology › Patent Owners And Lessors

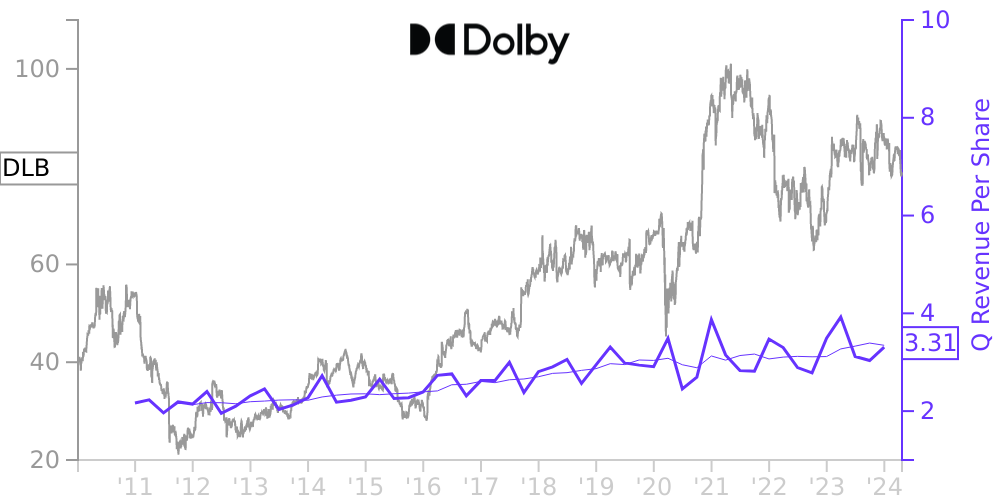
DLB Stock Price Correlated With Dolby Laboratories Financials
External Links ⌄
Income Statement
Cash Flow
Balance Sheet
DLB Income Statement
Enable JavaScript and reload
Revenue, Net:
Cost of Goods & Services Sold:
Gross Profit:
Selling, General & Admin Expense:
Research & Development Expense:
Total Operating Expenses:
Operating Income:
Income Taxes:
Net Income:
DLB Cash Flow
Enable JavaScript and reload
Operating Activities Net Income:
Depreciation, Depletion & Amortization:
Change in Accounts Receiveable:
Net Cash from Operations:
Repurchases/Buybacks Common Stock:
Issuance of Long-term Debt:
Cash Dividends Paid:
Net Cash from Financing Activities:
Property, Plant & Equipment Purchases:
Purchases of Businesses, Net of Cash:
Net Cash from Investing Activities:
Net Change in Cash & Equivalents:
DLB Balance Sheet
Enable JavaScript and reload
Cash and Cash Equivalents:
Short-Term Investments:
Accounts Receivable, Net:
Inventories:
Total Current Assets:
Property, Plant & Equipment, Net:
Total Assets:
Accounts Payable:
Current Portion of Long-Term Debt:
Total Short-Term Liabilities:
Long Term Debt, Non-Current Portion:
Total Long-Term Liabilities:
Total Liabilities:
COMPANY PROFILE
. Basis of Presentation Principles of Consolidation
The consolidated financial statements include the accounts of Dolby Laboratories, Inc. and our wholly owned subsidiaries. In addition, we have consolidated the financial results of jointly owned affiliated companies in which our principal stockholder has a controlling interest. We report these controlling interests as a separate line in our consolidated statements of operations as net income attributable to controlling interest and in our consolidated balance sheets as a controlling interest. We eliminate all intercompany accounts and transactions upon consolidation.
Use of Estimates
The preparation of our financial statements in accordance with U.S. GAAP requires management to make certain estimates and assumptions that affect the amounts reported and disclosed in our consolidated financial statements and accompanying notes.
Significant items subject to such estimates and assumptions include estimated shipments by our licensees for which we are owed a sales-based royalty. These estimates involve the use of historical data and judgment for several key attributes including industry estimates of expected shipments, the percentage of markets using our technologies, and average sale prices. Our estimates of royalty-based revenue also take into consideration the macroeconomic effect of global events, such as the COVID-19 pandemic or other natural disasters which may impact our licensees' supply chain activities as well as demand for shipments.
Additional significant items subject to such estimates and assumptions include ESPs for performance obligations within revenue arrangements; allowance for credit losses for accounts receivable; carrying values of inventories and certain PP&E, goodwill and intangible assets; fair values of investments; accrued liabilities including liabilities for unrecognized tax benefits, deferred income tax assets and liabilities, and stock-based compensation. Actual results could differ from our estimates.
Fiscal Year
Our fiscal year is a 52 or 53 week period ending on the last Friday in September. The fiscal years presented herein include the 52 week periods ended September 24, 2021 (fiscal 2021), September 25, 2020 (fiscal 2020), and September 27, 2019 (fiscal 2019). Our fiscal year ending September 30, 2022 (fiscal 2022) will consist of 53 weeks.
Reclassifications
We have reclassified certain prior period amounts within our consolidated financial statements and accompanying notes to conform to our current period presentation. These reclassifications did not affect total revenue, operating income, operating cash flows or net income.
Free historical financial statements for Dolby Laboratories Inc. See how revenue, income, cash flow, and balance sheet financials have changed over 62 quarters since 2010. Compare with DLB stock chart to see long term trends.
Data imported from Dolby Laboratories Inc SEC filings. Check original filings before making any investment decision.