Industrials › Blankbooks, Looseleaf Binders And Bookbinding And Related Work

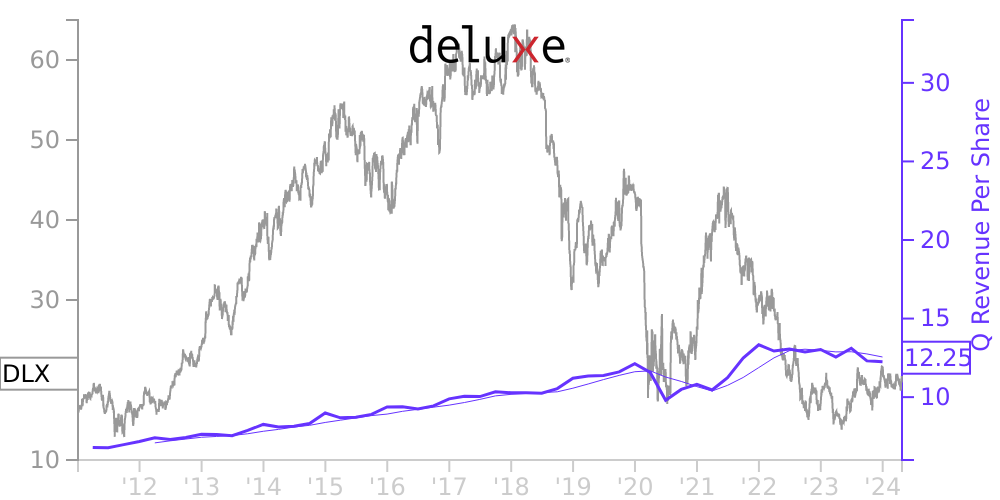
DLX Stock Price Correlated With Deluxe Financials
External Links ⌄
Income Statement
Cash Flow
Balance Sheet
DLX Income Statement
Enable JavaScript and reload
Revenue, Net:
Cost of Goods & Services Sold:
Gross Profit:
Selling, General & Admin Expense:
Research & Development Expense:
Total Operating Expenses:
Operating Income:
Income Taxes:
Net Income:
DLX Cash Flow
Enable JavaScript and reload
Operating Activities Net Income:
Depreciation, Depletion & Amortization:
Change in Accounts Receiveable:
Net Cash from Operations:
Repurchases/Buybacks Common Stock:
Issuance of Long-term Debt:
Cash Dividends Paid:
Net Cash from Financing Activities:
Property, Plant & Equipment Purchases:
Purchases of Businesses, Net of Cash:
Net Cash from Investing Activities:
Net Change in Cash & Equivalents:
DLX Balance Sheet
Enable JavaScript and reload
Cash and Cash Equivalents:
Short-Term Investments:
Accounts Receivable, Net:
Inventories:
Total Current Assets:
Property, Plant & Equipment, Net:
Total Assets:
Accounts Payable:
Current Portion of Long-Term Debt:
Total Short-Term Liabilities:
Long Term Debt, Non-Current Portion:
Total Long-Term Liabilities:
Total Liabilities:
COMPANY PROFILE
The consolidated balance sheet as of March 31, 2022, the consolidated statements of comprehensive income for the quarters ended March 31, 2022 and 2021, the consolidated statements of shareholders’ equity for the quarters ended March 31, 2022 and 2021 and the consolidated statements of cash flows for the quarters ended March 31, 2022 and 2021 are unaudited. The consolidated balance sheet as of December 31, 2021 was derived from audited consolidated financial statements, but does not include all disclosures required by U.S. generally accepted accounting principles (GAAP). In the opinion of management, all adjustments necessary for a fair statement of the consolidated financial statements are included. Adjustments consist only of normal recurring items, except for any items discussed in the notes below. Interim results are not necessarily indicative of results for a full year. The consolidated financial statements and notes are presented in accordance with instructions for Form 10-Q and do not contain certain information included in our annual consolidated financial statements and notes. The consolidated financial statements and notes appearing in this report should be read in conjunction with the consolidated audited financial statements and related notes included in our Annual Report on Form 10-K for the year ended December 31, 2021 (the 2021 Form 10-K).
The preparation of our consolidated financial statements requires us to make certain estimates and assumptions affecting the amounts reported in the consolidated financial statements and related notes. We base our estimates on historical experience and on various other factors and assumptions that we believe are reasonable under the circumstances, the results of which form the basis for making judgments about the carrying values of our assets, liabilities, revenues and expenses and the related disclosure of contingent assets and liabilities. Actual results may differ significantly from our estimates and assumptions.
Comparability – The consolidated statement of cash flows for the quarter ended March 31, 2021 has been modified to confirm to the current year presentation. We presented payments for cloud computing arrangement implementation costs separately within cash flows from operating activities. Previously, this amount was included in other non-current assets. Also, we included purchases of and proceeds from customer funds marketable securities within other investing activities. Previously, these amounts were presented separately. During the quarter ended March 31, 2022, we recorded out-of-period correcting adjustments that decreased net income attributable to Deluxe by $2,197. These adjustments were not material to any historical interim or annual period.
Free historical financial statements for Deluxe Corp. See how revenue, income, cash flow, and balance sheet financials have changed over 61 quarters since 2011. Compare with DLX stock chart to see long term trends.
Data imported from Deluxe Corp SEC filings. Check original filings before making any investment decision.