Industrials › Oil And Gas Filed Machinery And Equipment

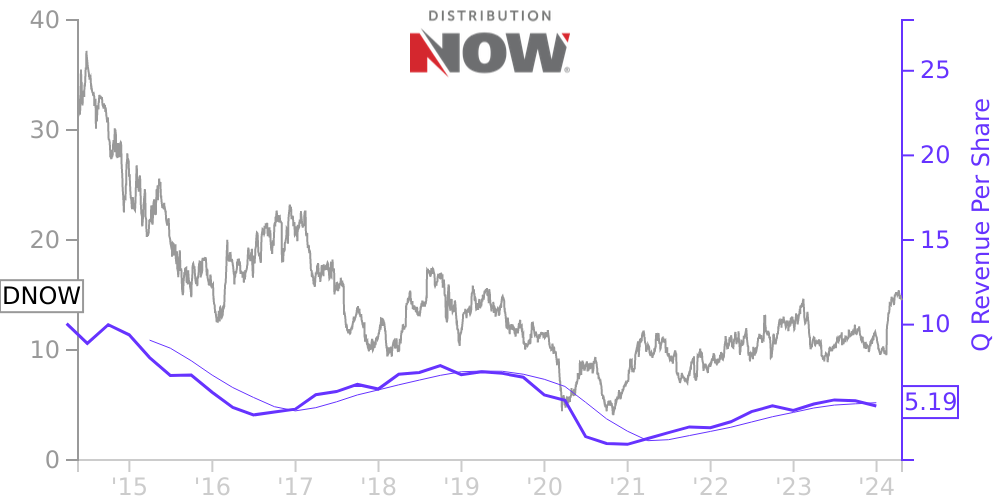
DNOW Stock Price Correlated With NOW Financials
External Links ⌄
Income Statement
Cash Flow
Balance Sheet
DNOW Income Statement
Enable JavaScript and reload
Revenue, Net:
Cost of Goods & Services Sold:
Gross Profit:
Selling, General & Admin Expense:
Research & Development Expense:
Total Operating Expenses:
Operating Income:
Income Taxes:
Net Income:
DNOW Cash Flow
Enable JavaScript and reload
Operating Activities Net Income:
Depreciation, Depletion & Amortization:
Change in Accounts Receiveable:
Net Cash from Operations:
Repurchases/Buybacks Common Stock:
Issuance of Long-term Debt:
Cash Dividends Paid:
Net Cash from Financing Activities:
Property, Plant & Equipment Purchases:
Purchases of Businesses, Net of Cash:
Net Cash from Investing Activities:
Net Change in Cash & Equivalents:
DNOW Balance Sheet
Enable JavaScript and reload
Cash and Cash Equivalents:
Short-Term Investments:
Accounts Receivable, Net:
Inventories:
Total Current Assets:
Property, Plant & Equipment, Net:
Total Assets:
Accounts Payable:
Current Portion of Long-Term Debt:
Total Short-Term Liabilities:
Long Term Debt, Non-Current Portion:
Total Long-Term Liabilities:
Total Liabilities:
COMPANY PROFILE
1. Organization and Basis of Presentation Nature of Operations NOW Inc. (“NOW” or the “Company”) is a holding company headquartered in Houston, Texas that was incorporated in Delaware on November 22, 2013. NOW operates primarily under the DistributionNOW and DNOW brands. NOW is a global distributor of energy products as well as products for industrial applications through its locations in the United States (“U.S.”), Canada and internationally which are geographically positioned to serve the energy and industrial markets in approximately 80 countries. Additionally, through the Company’s growing DigitalNOW® platform, customers can leverage world-class technology across ecommerce, data management and supply chain optimization applications to solve a wide array of complex operational and product sourcing challenges to assist in maximizing their return on assets. The Company’s energy product offering is consumed throughout all sectors of the energy industry – from upstream drilling and completion, exploration and production, midstream infrastructure development to downstream petroleum refining and petrochemicals – as well as in other industries, such as chemical processing, mining, utilities and renewables. The industrial distribution end markets include engineering and construction firms that perform capital and maintenance projects for their end user clients. NOW also provides supply chain and materials management solutions to the same markets where the Company sells products. NOW’s supplier network consists of thousands of vendors in approximately 40 countries.
Basis of Presentation The accompanying consolidated financial information include the accounts of the Company and its consolidated subsidiaries. All significant intercompany transactions and accounts have been eliminated.
Reclassification Certain amounts in the prior periods presented have been reclassified to conform to the current period financial statement presentation. These reclassifications have no effect on previously reported results of operations.
Recently Issued Accounting Standards
In March 2020, the Financial Accounting Standards Board (“FASB”) issued Accounting Standards Update (“ASU”) 2020-04, Reference Rate Reform (Topic 848), which provides optional expedients and exceptions to contracts, hedging relationships, and other transactions that reference LIBOR or another reference rate expected to be discontinued because of reference rate reform. Entities that elect the relief are required to disclose the nature of the optional expedients and exceptions that are adopted and the reasons for the adoptions. The guidance is effective upon issuance and the expedients and exceptions may be applied prospectively through December 31, 2022. The Company is currently assessing the impact of ASU 2020-04 on its consolidated financial statements but does not expect the adoption of this standard to have a material effect on its consolidated financial statements.
Free historical financial statements for NOW Inc.. See how revenue, income, cash flow, and balance sheet financials have changed over 49 quarters since 2014. Compare with DNOW stock chart to see long term trends.
Data imported from NOW Inc. SEC filings. Check original filings before making any investment decision.