Consumer Discretionary › RETAIL-FOOD STORES

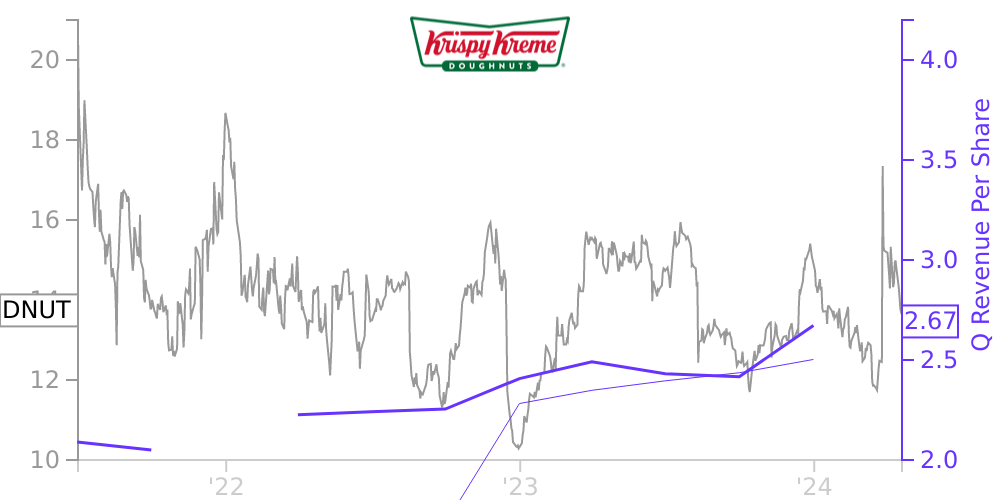
DNUT Stock Price Correlated With Krispy Kreme Financials
External Links ⌄
Income Statement
Cash Flow
Balance Sheet
DNUT Income Statement
Enable JavaScript and reload
Revenue, Net:
Cost of Goods & Services Sold:
Gross Profit:
Selling, General & Admin Expense:
Research & Development Expense:
Total Operating Expenses:
Operating Income:
Income Taxes:
Net Income:
DNUT Cash Flow
Enable JavaScript and reload
Operating Activities Net Income:
Depreciation, Depletion & Amortization:
Change in Accounts Receiveable:
Net Cash from Operations:
Repurchases/Buybacks Common Stock:
Issuance of Long-term Debt:
Cash Dividends Paid:
Net Cash from Financing Activities:
Property, Plant & Equipment Purchases:
Purchases of Businesses, Net of Cash:
Net Cash from Investing Activities:
Net Change in Cash & Equivalents:
DNUT Balance Sheet
Enable JavaScript and reload
Cash and Cash Equivalents:
Short-Term Investments:
Accounts Receivable, Net:
Inventories:
Total Current Assets:
Property, Plant & Equipment, Net:
Total Assets:
Accounts Payable:
Current Portion of Long-Term Debt:
Total Short-Term Liabilities:
Long Term Debt, Non-Current Portion:
Total Long-Term Liabilities:
Total Liabilities:
COMPANY PROFILE
Description of Business and Summary of Significant Accounting Policies Description of Business
Krispy Kreme, Inc. (“KKI”) and its subsidiaries (collectively, the “Company” or “Krispy Kreme”) operates through its omni-channel business model to provide doughnut experiences and produce doughnuts for Doughnut Shops, Delivered Fresh Daily (“DFD”) outlets, Ecommerce and delivery, and Krispy Kreme branded sweet treats (“Branded Sweet Treat Line”) channels, expanding consumer access to the Krispy Kreme brand.
The Company has three reportable operating segments: 1) U.S. and Canada, which includes all Krispy Kreme Company-owned operations in the U.S. and Canada, Insomnia Cookies shops and the Branded Sweet Treat Line; 2) International, which includes all Krispy Kreme Company-owned operations in the U.K., Ireland, Australia, New Zealand and Mexico; and 3) Market Development, which includes franchise operations across the globe, as well as Krispy Kreme Company-owned shops in Japan. Unallocated corporate costs are excluded from the Company’s measurement of segment performance.
Basis of Presentation and Consolidation
The Company operates and reports financial information on a 52 or 53-week year with the fiscal year ending on the Sunday closest to December 31. The data periods contained within fiscal years 2021 and 2022 reflect the results of operations for the 52-week periods ended January 2, 2022 and January 1, 2023, respectively. The quarters ended April 3, 2022 and April 4, 2021 were both 13-week periods.
The unaudited Condensed Consolidated Financial Statements include the accounts of KKI and subsidiaries and have been prepared in accordance with accounting principles generally accepted in the United States of America (“U.S. GAAP”) for interim financial information and pursuant to the rules and regulations of the Securities and Exchange Commission (“SEC”). Accordingly, these interim financial statements do not include all information and footnotes required under U.S. GAAP for complete financial statements. In the opinion of management, the accompanying unaudited Condensed Consolidated Financial Statements contain all adjustments, consisting of only normal recurring adjustments, necessary for a fair statement of results of operations, balance sheet, cash flows, and shareholders’ equity for the periods presented. All significant intercompany balances and transactions among KKI and subsidiaries have been eliminated in consolidation. Investments in entities over which the Company has the ability to exercise significant influence but which it does not control and whose financial statements are not otherwise required to be consolidated, are accounted for using the equity method.
These Condensed Consolidated Financial Statements should be read in conjunction with the Consolidated Financial Statements and notes thereto as of and for the year ended January 2, 2022, included in the Annual Report on Form 10-K. The Condensed Consolidated Balance Sheet as of January 2, 2022 was derived from audited annual financial statements but does not contain all of the footnote disclosures from the annual financial statements. The results of operations for the first quarter ended April 3, 2022 are not necessarily indicative of the results of operations that may be achieved for the entire fiscal year ending January 1, 2023.
Noncontrolling interest in the Company’s Condensed Consolidated Financial Statements represents the interest in subsidiaries held by joint venture partners and employee shareholders. The joint venture partners hold noncontrolling interests in the Company’s consolidated subsidiaries, Awesome Doughnut, LLC (“Awesome Doughnut”), W.K.S. Krispy Kreme, LLC (“WKS Krispy Kreme”), and Krispy K Canada, Inc. (“KK Canada”). Employee shareholders hold noncontrolling interests in the consolidated subsidiaries Krispy Kreme Holding U.K. Ltd. (“KKUK”), Krispy Kreme Holdings Pty Ltd. (“KK Australia”), Krispy Kreme Mexico S. de R.L. de C.V. (“KK Mexico”)
Free historical financial statements for Krispy Kreme Inc.. See how revenue, income, cash flow, and balance sheet financials have changed over 20 quarters since 2021. Compare with DNUT stock chart to see long term trends.
Data imported from Krispy Kreme Inc. SEC filings. Check original filings before making any investment decision.