Consumer Discretionary › Motor Vehicle Parts And Accessories

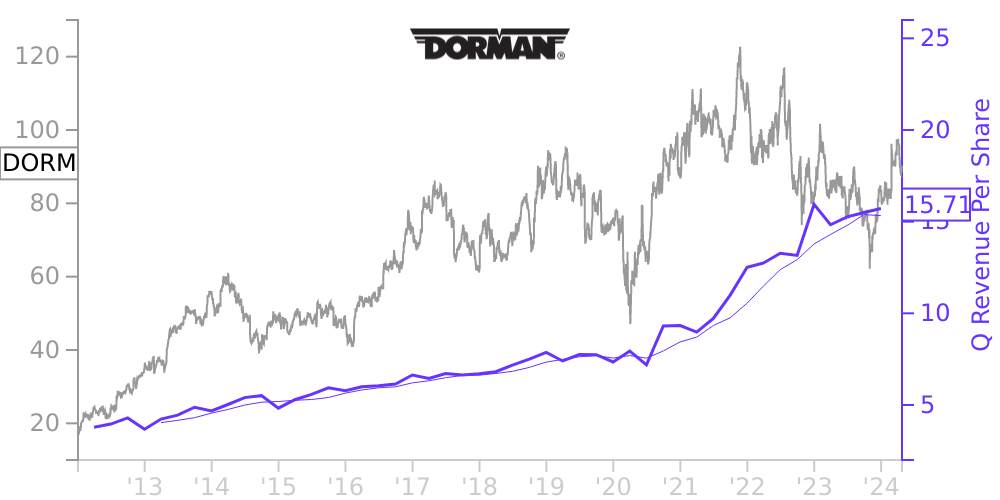
DORM Stock Price Correlated With Dorman Products Financials
External Links ⌄
Income Statement
Cash Flow
Balance Sheet
DORM Income Statement
Enable JavaScript and reload
Revenue, Net:
Cost of Goods & Services Sold:
Gross Profit:
Selling, General & Admin Expense:
Research & Development Expense:
Total Operating Expenses:
Operating Income:
Income Taxes:
Net Income:
DORM Cash Flow
Enable JavaScript and reload
Operating Activities Net Income:
Depreciation, Depletion & Amortization:
Change in Accounts Receiveable:
Net Cash from Operations:
Repurchases/Buybacks Common Stock:
Issuance of Long-term Debt:
Cash Dividends Paid:
Net Cash from Financing Activities:
Property, Plant & Equipment Purchases:
Purchases of Businesses, Net of Cash:
Net Cash from Investing Activities:
Net Change in Cash & Equivalents:
DORM Balance Sheet
Enable JavaScript and reload
Cash and Cash Equivalents:
Short-Term Investments:
Accounts Receivable, Net:
Inventories:
Total Current Assets:
Property, Plant & Equipment, Net:
Total Assets:
Accounts Payable:
Current Portion of Long-Term Debt:
Total Short-Term Liabilities:
Long Term Debt, Non-Current Portion:
Total Long-Term Liabilities:
Total Liabilities:
COMPANY PROFILE
1.
Basis of Presentation
As used herein, unless the context requires otherwise, “Dorman,” the “Company,” “we,” “us,” or “our” refers to Dorman Products, Inc. and its subsidiaries. Our ticker symbol on the NASDAQ Global Select Market is “DORM.”
The accompanying unaudited condensed consolidated financial statements have been prepared under U.S. generally accepted accounting principles (“GAAP”) for interim financial information and under the rules and regulations of the U.S. Securities and Exchange Commission. However, they do not include all the information and footnotes required by GAAP for complete financial statements. In the opinion of management, all adjustments (consisting of only normal recurring adjustments) considered necessary for a fair presentation have been included. Operating results for the three and six months ended June 25, 2022 are not necessarily indicative of the results that may be expected for the fiscal year ending December 31, 2022 or any future period. We may experience significant fluctuations from quarter to quarter in our results of operations due to the timing of orders placed by our customers. The introduction of new products and product lines to customers may cause significant fluctuations from quarter to quarter. These financial statements should be read in conjunction with the consolidated financial statements and footnotes thereto included in our Annual Report on Form 10-K for the fiscal year ended December 25, 2021.
Free historical financial statements for Dorman Products Inc. See how revenue, income, cash flow, and balance sheet financials have changed over 57 quarters since 2012. Compare with DORM stock chart to see long term trends.
Data imported from Dorman Products Inc SEC filings. Check original filings before making any investment decision.