Consumer Discretionary › Sporting & Athletic Goods, NEC

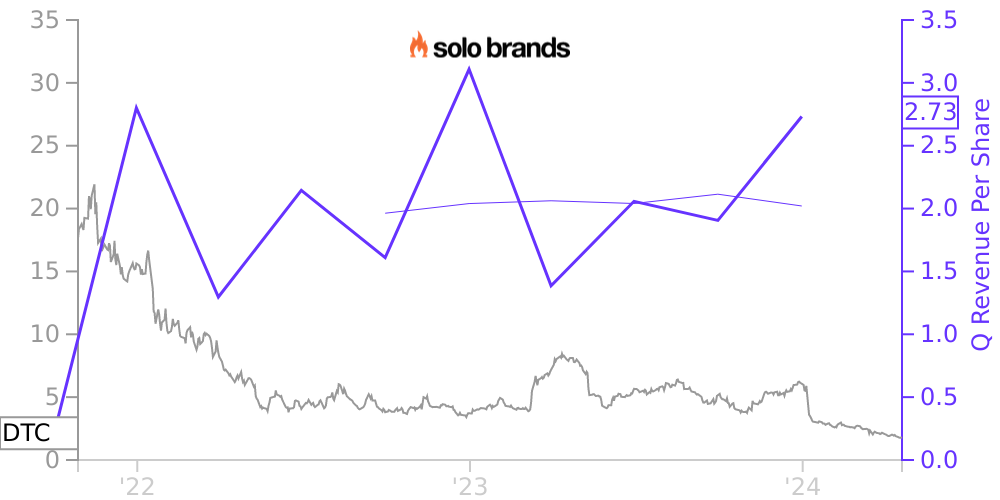
DTC Stock Price Correlated With Solo Brands Financials
External Links ⌄
Income Statement
Cash Flow
Balance Sheet
DTC Income Statement
Enable JavaScript and reload
Revenue, Net:
Cost of Goods & Services Sold:
Gross Profit:
Selling, General & Admin Expense:
Research & Development Expense:
Total Operating Expenses:
Operating Income:
Income Taxes:
Net Income:
DTC Cash Flow
Enable JavaScript and reload
Operating Activities Net Income:
Depreciation, Depletion & Amortization:
Change in Accounts Receiveable:
Net Cash from Operations:
Repurchases/Buybacks Common Stock:
Issuance of Long-term Debt:
Cash Dividends Paid:
Net Cash from Financing Activities:
Property, Plant & Equipment Purchases:
Purchases of Businesses, Net of Cash:
Net Cash from Investing Activities:
Net Change in Cash & Equivalents:
DTC Balance Sheet
Enable JavaScript and reload
Cash and Cash Equivalents:
Short-Term Investments:
Accounts Receivable, Net:
Inventories:
Total Current Assets:
Property, Plant & Equipment, Net:
Total Assets:
Accounts Payable:
Current Portion of Long-Term Debt:
Total Short-Term Liabilities:
Long Term Debt, Non-Current Portion:
Total Long-Term Liabilities:
Total Liabilities:
COMPANY PROFILE
Solo Brands, Inc. (“Company” or “Solo Brands”), through a wholly-owned subsidiary, Solo Stove Holdings, LLC (“Holdings”), operates four premium brands—Solo Stove, Oru Kayak (“Oru”), ISLE Paddle Boards (“ISLE”), and Chubbies apparel. Solo Stove offers portable, low-smoke fire pits, grills, and camping stoves for backyard and outdoor use in different sizes, fire pit bundles, gear kits, stoves, cookware, dinnerware, and a variety of clothing and accessories. Oru offers a flagship line of lightweight, foldable kayaks. ISLE produces high-quality stand-up paddle boards with colorful designs that are engineered to accommodate every skill level, style, and interest. Chubbies is a fun-loving, premium apparel brand that offers well-fitted comfortable clothing with unique style. Solo Brands distributes its products through individual brand websites and other partners across North America, Europe and Australia.
Free historical financial statements for Solo Brands Inc.. See how revenue, income, cash flow, and balance sheet financials have changed over 15 quarters since 2021. Compare with DTC stock chart to see long term trends.
Data imported from Solo Brands Inc. SEC filings. Check original filings before making any investment decision.