Energy › Crude Petroleum And Natural Gas

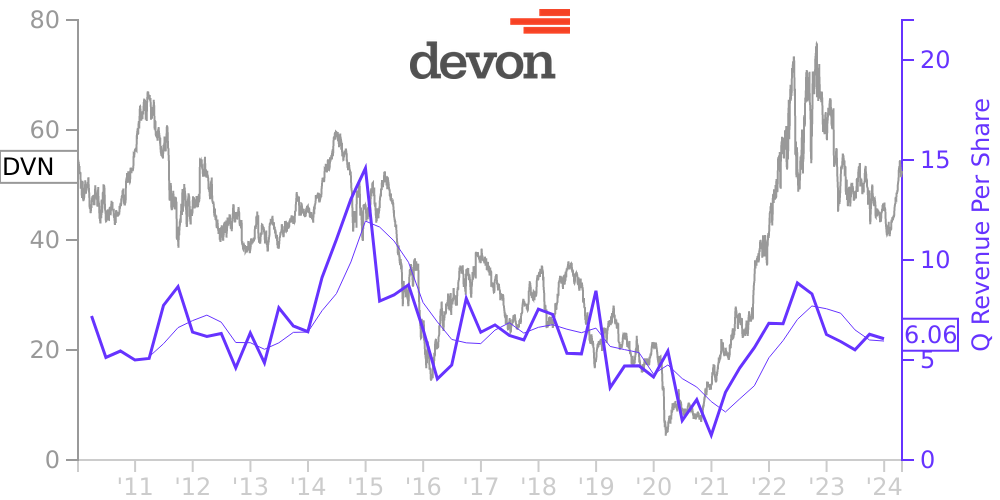
DVN Stock Price Correlated With Devon Energy Financials
External Links ⌄
Income Statement
Cash Flow
Balance Sheet
DVN Income Statement
Enable JavaScript and reload
Revenue, Net:
Cost of Goods & Services Sold:
Gross Profit:
Selling, General & Admin Expense:
Research & Development Expense:
Total Operating Expenses:
Operating Income:
Income Taxes:
Net Income:
DVN Cash Flow
Enable JavaScript and reload
Operating Activities Net Income:
Depreciation, Depletion & Amortization:
Change in Accounts Receiveable:
Net Cash from Operations:
Repurchases/Buybacks Common Stock:
Issuance of Long-term Debt:
Cash Dividends Paid:
Net Cash from Financing Activities:
Property, Plant & Equipment Purchases:
Purchases of Businesses, Net of Cash:
Net Cash from Investing Activities:
Net Change in Cash & Equivalents:
DVN Balance Sheet
Enable JavaScript and reload
Cash and Cash Equivalents:
Short-Term Investments:
Accounts Receivable, Net:
Inventories:
Total Current Assets:
Property, Plant & Equipment, Net:
Total Assets:
Accounts Payable:
Current Portion of Long-Term Debt:
Total Short-Term Liabilities:
Long Term Debt, Non-Current Portion:
Total Long-Term Liabilities:
Total Liabilities:
COMPANY PROFILE
Devon is a leading independent energy company engaged primarily in the exploration, development and production of oil, natural gas and NGLs. Devon’s operations are concentrated in various onshore areas in the U.S.
Devon and WPX completed an all-stock merger of equals on January 7, 2021. On the closing date of the Merger, each share of WPX common stock was automatically converted into the right to receive 0.5165 of a share of Devon common stock. The transaction has been accounted for using the acquisition method of accounting, with Devon being treated as the accounting acquirer. See Note 2 for further discussion.
As further discussed in Note 19 , Devon sold its Barnett Shale assets on October 1, 2020 and sold its Canadian operations on June 27, 2019. Prior to December 31, 2020, activity relating to Devon’s Barnett Shale assets and Canadian operations are classified as discontinued operations within Devon’s consolidated statements of comprehensive earnings and consolidated statements of cash flows.
Accounting policies used by Devon and its subsidiaries conform to accounting principles generally accepted in the U.S. and reflect industry practices. The more significant of such policies are discussed below.
Free historical financial statements for Devon Energy Corp. See how revenue, income, cash flow, and balance sheet financials have changed over 65 quarters since 2010. Compare with DVN stock chart to see long term trends.
Data imported from Devon Energy Corp SEC filings. Check original filings before making any investment decision.