Technology › Services-Computer Processing And Data Preparation

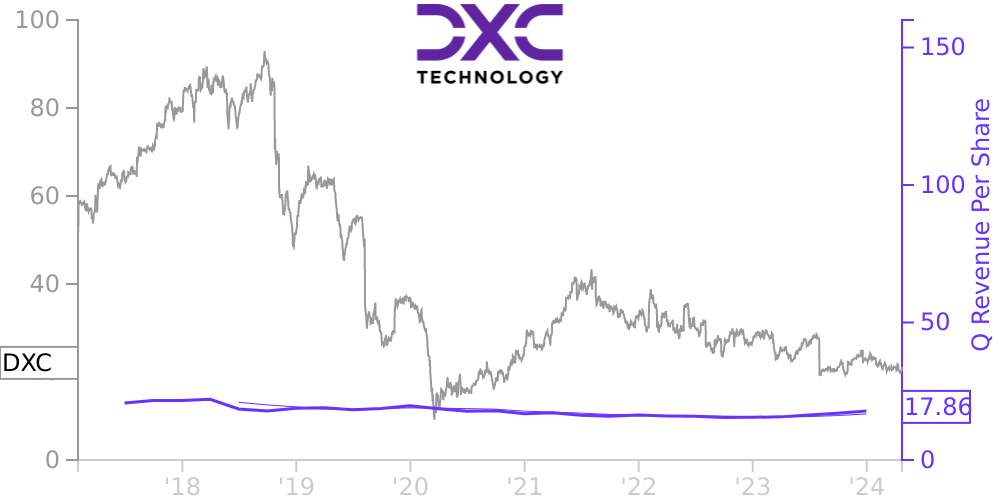
DXC Stock Price Correlated With DXC Technology Co Financials
External Links ⌄
Income Statement
Cash Flow
Balance Sheet
DXC Income Statement
Enable JavaScript and reload
Revenue, Net:
Cost of Goods & Services Sold:
Gross Profit:
Selling, General & Admin Expense:
Research & Development Expense:
Total Operating Expenses:
Operating Income:
Income Taxes:
Net Income:
DXC Cash Flow
Enable JavaScript and reload
Operating Activities Net Income:
Depreciation, Depletion & Amortization:
Change in Accounts Receiveable:
Net Cash from Operations:
Repurchases/Buybacks Common Stock:
Issuance of Long-term Debt:
Cash Dividends Paid:
Net Cash from Financing Activities:
Property, Plant & Equipment Purchases:
Purchases of Businesses, Net of Cash:
Net Cash from Investing Activities:
Net Change in Cash & Equivalents:
DXC Balance Sheet
Enable JavaScript and reload
Cash and Cash Equivalents:
Short-Term Investments:
Accounts Receivable, Net:
Inventories:
Total Current Assets:
Property, Plant & Equipment, Net:
Total Assets:
Accounts Payable:
Current Portion of Long-Term Debt:
Total Short-Term Liabilities:
Long Term Debt, Non-Current Portion:
Total Long-Term Liabilities:
Total Liabilities:
COMPANY PROFILE
Summary of Significant Accounting Policies Business
DXC Technology Company ("DXC" or the "Company") helps global companies run their mission critical systems and operations while modernizing IT, optimizing data architectures, and ensuring security and scalability across public, private and hybrid clouds. With decades of driving innovation, the world’s largest companies trust DXC to deploy its Enterprise Technology Stack to deliver new levels of performance, competitiveness and customer experiences.
HPS Sale
On April 1, 2021, DXC completed the sale of its healthcare provider software business ("HPS" or the "HPS Business") to Dedalus Holding S.p.A. ("Dedalus"). The sale was accomplished by the cash purchase of all equity interests and assets attributable to the HPS Business for €462 million (approximately $543 million), subject to certain adjustments. See Note 4 - "Assets Held for Sale" and Note 24 - "Subsequent Events" for further information.
HHS Sale
On October 1, 2020, DXC completed the sale of its U.S. State and Local Health and Human Services business ("HHS" or the "HHS Business") to Veritas Capital Fund Management, L.L.C. ("Veritas Capital") to form Gainwell Technologies. The sale was accomplished by the cash purchase of all equity interests and assets attributable to the HHS Business together with future services to be provided by the Company for a total enterprise value of $5.0 billion, subject to net working capital adjustments and assumed liabilities. See Note 3 - "Divestitures" for further information.
Luxoft Acquisition
On June 14, 2019, DXC completed its acquisition of Luxoft Holding, Inc. ("Luxoft"), a global digital strategy and software engineering firm (the "Luxoft Acquisition"). The acquisition builds on DXC’s unique value proposition as an end-to-end, mainstream IT and digital services market leader and strengthens the Company’s ability to design and deploy transformative digital solutions for customers at scale. See Note 2 - "Acquisitions" for further information.
Basis of Presentation
In order to make this report easier to read, DXC refers throughout to (i) the Consolidated Financial Statements as the “financial statements,” (ii) the Consolidated Statements of Operations as the “statements of operations,” (iii) the Consolidated Statement of Comprehensive Income (Loss) as the "statements of comprehensive income," (iv) the Consolidated Balance Sheets as the “balance sheets,” and (v) the Consolidated Statements of Cash Flows as the “statements of cash flows.” In addition, references throughout to numbered “Notes” refer to the numbered Notes in these Notes to Consolidated Financial Statements unless otherwise noted.
The accompanying financial statements have been prepared in accordance with the rules and regulations of the U.S. Securities and Exchange Commission for annual reports and accounting principles generally accepted in the United States ("GAAP"). The financial statements include the accounts of DXC, its consolidated subsidiaries, and those business entities in which DXC maintains a controlling interest. Investments in business entities in which the Company does not have control, but has the ability to exercise significant influence over operating and financial policies, are accounted for by the equity method. Other investments are accounted for by the cost method. Non-controlling interests are presented as a separate component within equity in the balance sheets. Net earnings attributable to the non-controlling interests are presented separately in the statements of operations, and comprehensive income attributable to non-controlling interests are presented separately in the statements of comprehensive income. All intercompany transactions and balances have been eliminated. Certain amounts reported in the previous year have been reclassified to conform to the current year presentation.
Use of Estimates
The preparation of the financial statements, in accordance with GAAP, requires the Compan
Free historical financial statements for DXC Technology Co.. See how revenue, income, cash flow, and balance sheet financials have changed over 36 quarters since 2017. Compare with DXC stock chart to see long term trends.
Data imported from DXC Technology Co. SEC filings. Check original filings before making any investment decision.