Technology › Industrial Instruments For Measurement, Display, And Control

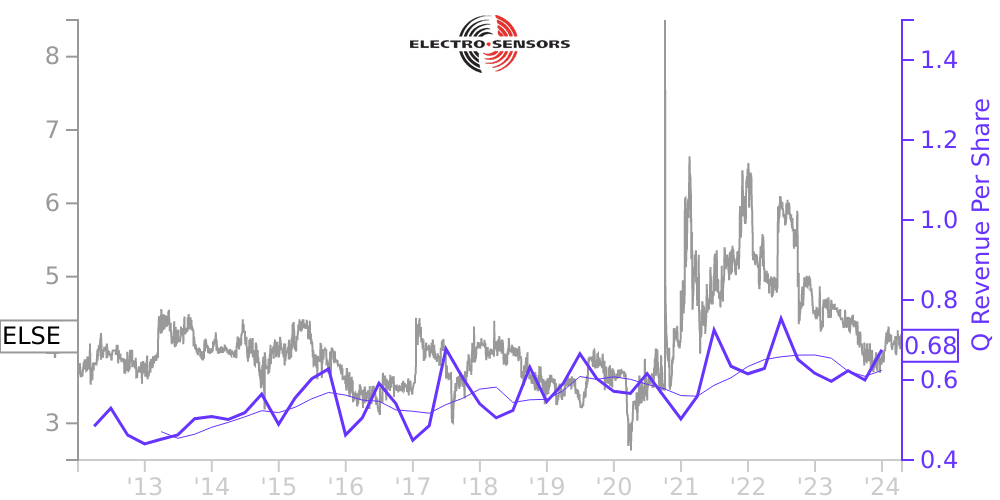
ELSE Stock Price Correlated With Electro Sensors Financials
External Links ⌄
Income Statement
Cash Flow
Balance Sheet
ELSE Income Statement
Enable JavaScript and reload
Revenue, Net:
Cost of Goods & Services Sold:
Gross Profit:
Selling, General & Admin Expense:
Research & Development Expense:
Total Operating Expenses:
Operating Income:
Income Taxes:
Net Income:
ELSE Cash Flow
Enable JavaScript and reload
Operating Activities Net Income:
Depreciation, Depletion & Amortization:
Change in Accounts Receiveable:
Net Cash from Operations:
Repurchases/Buybacks Common Stock:
Issuance of Long-term Debt:
Cash Dividends Paid:
Net Cash from Financing Activities:
Property, Plant & Equipment Purchases:
Purchases of Businesses, Net of Cash:
Net Cash from Investing Activities:
Net Change in Cash & Equivalents:
ELSE Balance Sheet
Enable JavaScript and reload
Cash and Cash Equivalents:
Short-Term Investments:
Accounts Receivable, Net:
Inventories:
Total Current Assets:
Property, Plant & Equipment, Net:
Total Assets:
Accounts Payable:
Current Portion of Long-Term Debt:
Total Short-Term Liabilities:
Long Term Debt, Non-Current Portion:
Total Long-Term Liabilities:
Total Liabilities:
COMPANY PROFILE
Note 1. B asis of Pr esentation
The accompanying unaudited financial statements have been prepared in accordance with accounting principles generally accepted in the United States of America for interim financial information and with the instructions and regulations of the Securities and Exchange Commission to Form 10-Q. Accordingly, they do not include all of the information and footnotes required by accounting principles generally accepted in the United States of America for complete financial statements.
This report should be read together with the Company’s Annual Report on Form 10-K for the year ended December 31, 2021, including the audited financial statements and footnotes therein.
Management believes that the unaudited financial statements include all adjustments, consisting of normal recurring accruals, necessary to fairly state the financial position and results of operations as of March 31, 2022 and for the three-month periods ended March 31, 2022 and 2021, in accordance with accounting principles generally accepted in the United States of America. The results of interim periods may not be indicative of results to be expected for the year.
Nature of Business
Electro-Sensors, Inc. manufactures and markets a complete line of monitoring and control systems for a wide range of industrial machine applications. The Company uses leading-edge technology to continuously improve its products, with the ultimate goal of manufacturing the industry-preferred product for each of our served markets. The Company sells these products through an internal sales staff, manufacturers’ representatives, and distributors to a wide range of industries that use the products in a variety of applications to monitor process machinery operations. The Company markets its products to customers located throughout the United States, Canada, Latin America, Europe, and Asia.
Re venue Rec ognition
At contract inception, the Company assesses the goods and services to be provided to a customer and identifies a performance obligation for each distinct good or service. We also determine the transaction price for each performance obligation at contract inception. Our contracts, generally in the form of a purchase order, specify the product or service that is to be provided to the customer. The typical contract life is less than one month and contains a single performance obligation, to provide conforming goods or services to the customer. Certain contracts have a second performance obligation, which typically is the initialization of the HazardPRO TM product. For contracts that have multiple performance obligations, we allocate the transaction price to each performance obligation using the relative stand-alone selling price. We generally determine stand-alone selling prices based on the observable stand-alone prices charged to customers. We recognize product revenue at the point in time when control of the product is transferred to the customer, which typically occurs when we ship the products. We recognize service revenue at the point in time when we have provided the service.
Fair Value Measurements
The carrying value of trade receivables, accounts payable, and other financial working capital items approximates fair value at March 31, 2022 and December 31, 2021, due to the short maturity nature of these instruments.
Intangibles
The intangible asset is a technology license. The Company amortizes the cost of the intangible asset on a straight-line method over the estimated useful life. At March 31, 2021, the Company also had the HazardPRO technology, which was fully amortized in the 2021 third quarter.
Stock-Based Compensation
The Company records compensation expense for stock options based on the estimated fair value of the options on the date of grant using the Black-Scholes-Merton (“BSM”) option pricing model. The Company uses historical data, among other factors, to estimate the expected price volatility, the expected option life, and the
Free historical financial statements for Electro Sensors Inc. See how revenue, income, cash flow, and balance sheet financials have changed over 57 quarters since 2012. Compare with ELSE stock chart to see long term trends.
Data imported from Electro Sensors Inc SEC filings. Check original filings before making any investment decision.