Industrials › Electronic And Other Electrical Equipment (No Computer Equip)

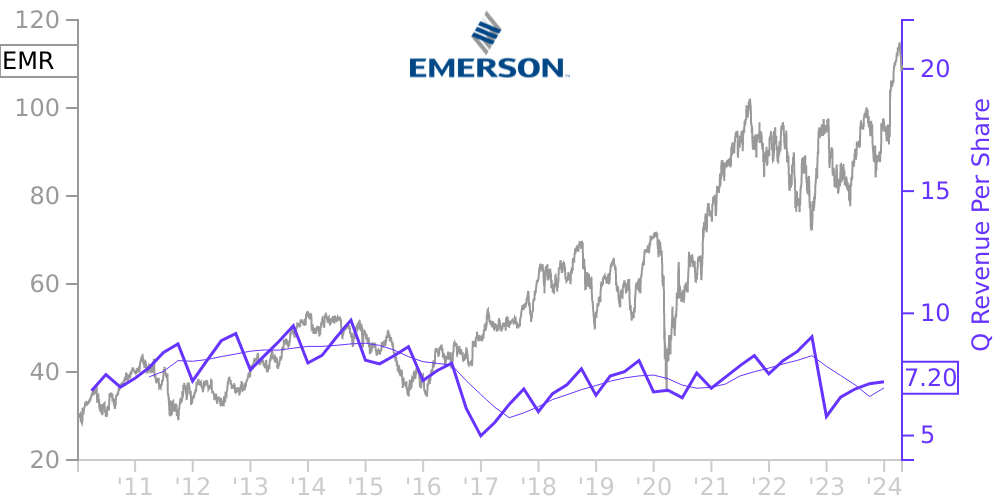
EMR Stock Price Correlated With Emerson Electric Co Financials
External Links ⌄
Income Statement
Cash Flow
Balance Sheet
EMR Income Statement
Enable JavaScript and reload
Revenue, Net:
Cost of Goods & Services Sold:
Gross Profit:
Selling, General & Admin Expense:
Research & Development Expense:
Total Operating Expenses:
Operating Income:
Income Taxes:
Net Income:
EMR Cash Flow
Enable JavaScript and reload
Operating Activities Net Income:
Depreciation, Depletion & Amortization:
Change in Accounts Receiveable:
Net Cash from Operations:
Repurchases/Buybacks Common Stock:
Issuance of Long-term Debt:
Cash Dividends Paid:
Net Cash from Financing Activities:
Property, Plant & Equipment Purchases:
Purchases of Businesses, Net of Cash:
Net Cash from Investing Activities:
Net Change in Cash & Equivalents:
EMR Balance Sheet
Enable JavaScript and reload
Cash and Cash Equivalents:
Short-Term Investments:
Accounts Receivable, Net:
Inventories:
Total Current Assets:
Property, Plant & Equipment, Net:
Total Assets:
Accounts Payable:
Current Portion of Long-Term Debt:
Total Short-Term Liabilities:
Long Term Debt, Non-Current Portion:
Total Long-Term Liabilities:
Total Liabilities:
COMPANY PROFILE
BASIS OF PRESENTATION In the opinion of management, the accompanying unaudited consolidated financial statements include all adjustments necessary for a fair presentation of operating results for the interim periods presented. Adjustments consist of normal and recurring accruals. The consolidated financial statements are presented in accordance with the requirements of Form 10-Q and consequently do not include all disclosures required for annual financial statements presented in conformity with U.S. generally accepted accounting principles (GAAP). For further information, refer to the consolidated financial statements and notes thereto included in the Company's Annual Report on Form 10-K for the year ended September 30, 2021.
Effective October 1, 2021, the Company adopted three accounting standard updates which had no impact or an immaterial impact on the Company's financial statements as of and for the six months ended March 31, 2022. These included:
• Updates to ASC 805, Business Combinations , which clarify the accounting for contract assets and liabilities assumed in a business combination. In general, this will result in contract liabilities being recognized at their historical amounts under ASC 606, rather than at fair value in accordance with the general requirements of ASC 805.
• Updates to ASC 740, Income Taxes , which require the recognition of a franchise tax that is partially based on income as an income-based tax with any incremental amount as a non-income based tax. These updates also make certain changes to intra-period tax allocation principles and interim tax calculations.
• Updates to ASC 321, Equity Securities , ASC 323 Investments - Equity Method and Joint Ventures , and ASC 815, Derivatives and Hedging , which clarify how to account for the transition into and out of the equity method of accounting when evaluating observable transactions.
Free historical financial statements for Emerson Electric Co.. See how revenue, income, cash flow, and balance sheet financials have changed over 66 quarters since 2009. Compare with EMR stock chart to see long term trends.
Data imported from Emerson Electric Co. SEC filings. Check original filings before making any investment decision.