Energy › Crude Petroleum And Natural Gas

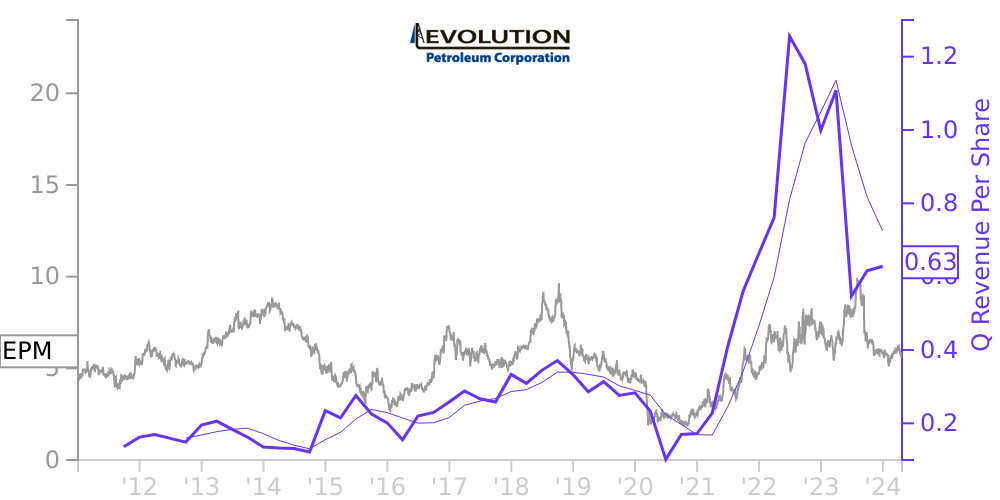
EPM Stock Price Correlated With Evolution Petroleum Financials
External Links ⌄
Income Statement
Cash Flow
Balance Sheet
EPM Income Statement
Enable JavaScript and reload
Revenue, Net:
Cost of Goods & Services Sold:
Gross Profit:
Selling, General & Admin Expense:
Research & Development Expense:
Total Operating Expenses:
Operating Income:
Income Taxes:
Net Income:
EPM Cash Flow
Enable JavaScript and reload
Operating Activities Net Income:
Depreciation, Depletion & Amortization:
Change in Accounts Receiveable:
Net Cash from Operations:
Repurchases/Buybacks Common Stock:
Issuance of Long-term Debt:
Cash Dividends Paid:
Net Cash from Financing Activities:
Property, Plant & Equipment Purchases:
Purchases of Businesses, Net of Cash:
Net Cash from Investing Activities:
Net Change in Cash & Equivalents:
EPM Balance Sheet
Enable JavaScript and reload
Cash and Cash Equivalents:
Short-Term Investments:
Accounts Receivable, Net:
Inventories:
Total Current Assets:
Property, Plant & Equipment, Net:
Total Assets:
Accounts Payable:
Current Portion of Long-Term Debt:
Total Short-Term Liabilities:
Long Term Debt, Non-Current Portion:
Total Long-Term Liabilities:
Total Liabilities:
COMPANY PROFILE
Organization and Basis of Preparation Nature of Operations. Evolution Petroleum Corporation is an oil and natural gas company focused on delivering a sustainable dividend yield to its stockholders through the ownership, management, and development of producing oil and natural gas properties. The Company's long-term goal is to build a diversified portfolio of oil and natural gas assets primarily through acquisitions while seeking opportunities to maintain and increase production through selective development, production enhancement, and other exploitation efforts on its properties.
Our producing assets consist of our interests in the Delhi Holt-Bryant Unit in the Delhi field in Northeast Louisiana, a CO 2 enhanced oil recovery (“EOR”) project, our interests in the Hamilton Dome field located in Hot Springs County, Wyoming, a secondary recovery field utilizing water injection wells to pressurize the reservoir, our interests in the Barnett Shale located in North Texas, a natural gas producing shale reservoir, and overriding royalty interests in two onshore Texas wells.
Principles of Consolidation and Reporting. Our consolidated financial statements include the accounts of Evolution Petroleum Corporation and its wholly-owned subsidiaries (the “Company”). All significant intercompany transactions have been eliminated in consolidation. The consolidated financial statements for the previous year may include certain reclassifications to conform to the current presentation. Any such reclassifications have no impact on previously reported net income or stockholders' equity.
Risk and Uncertainties. The Company is continuously monitoring impacts of the COVID-19 pandemic on its business, including how it has and may continue to impact its financial results, liquidity, employees, and the operations of the Delhi field, Hamilton Dome fields, and its Barnett Shale assets in which it holds non-operated interests.
In response to the pandemic, the operator at Hamilton Dome temporarily shut-in some producing wells. In addition to the above, the pandemic slowed the repair schedule of the Delhi CO 2 supply pipeline which, together with the foregoing, negatively impacted our production. All of the Company’s property interests are not operated by the Company and involve other third-party working interest owners. As a result, the Company has limited ability to influence or control the operation or future development of such properties. However, the Company has been proactive with its third-party operators to review spend and alter plans as appropriate.
The Company is focused on putting long term measures to prevent future disruptions, maintaining its operations and system of controls remotely and has implemented its business continuity plans in order to allow its employees to securely work from home or in the corporate office. The Company was able to transition the operation of its business with minimal disruption and has maintained its system of internal controls and procedures.
Use of Estimates. The preparation of financial statements in conformity with GAAP requires us to make estimates and assumptions that affect the reported amounts of assets and liabilities at the dates of the financial statements and the reported amounts of revenues and expenses during the reporting periods. Significant estimates include (a) reserve quantities and estimated future cash flows associated with proved reserves, which may significantly impact depletion expense and potential impairments of oil and natural gas properties, (b) asset retirement obligations, (c) stock-based compensation, (d) fair values of derivative assets and liabilities, (e) income taxes and the valuation of deferred tax assets, (f) commitments and contingencies and (g) oil, natural gas, and NGL revenues. We analyze our estimates based on historical experience and various other assumptions that we believe to be reasonable. While we believe that our estimates and assumptions used in preparation o
Free historical financial statements for Evolution Petroleum Corp. See how revenue, income, cash flow, and balance sheet financials have changed over 59 quarters since 2011. Compare with EPM stock chart to see long term trends.
Data imported from Evolution Petroleum Corp SEC filings. Check original filings before making any investment decision.