
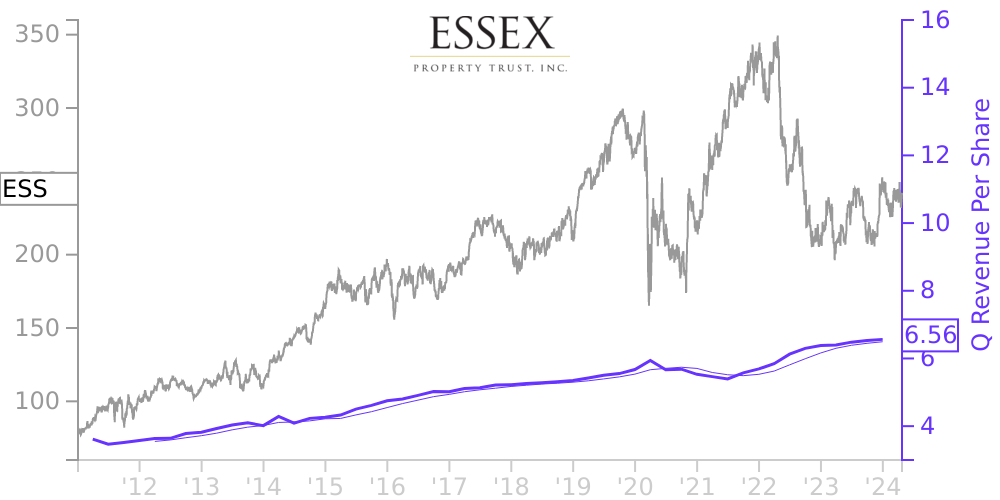
ESS Stock Price Correlated With Essex Property Trust Financials
External Links ⌄
Income Statement
Cash Flow
Balance Sheet
ESS Income Statement
Enable JavaScript and reload
Revenue, Net:
Cost of Goods & Services Sold:
Gross Profit:
Selling, General & Admin Expense:
Research & Development Expense:
Total Operating Expenses:
Operating Income:
Income Taxes:
Net Income:
ESS Cash Flow
Enable JavaScript and reload
Operating Activities Net Income:
Depreciation, Depletion & Amortization:
Change in Accounts Receiveable:
Net Cash from Operations:
Repurchases/Buybacks Common Stock:
Issuance of Long-term Debt:
Cash Dividends Paid:
Net Cash from Financing Activities:
Property, Plant & Equipment Purchases:
Purchases of Businesses, Net of Cash:
Net Cash from Investing Activities:
Net Change in Cash & Equivalents:
ESS Balance Sheet
Enable JavaScript and reload
Cash and Cash Equivalents:
Short-Term Investments:
Accounts Receivable, Net:
Inventories:
Total Current Assets:
Property, Plant & Equipment, Net:
Total Assets:
Accounts Payable:
Current Portion of Long-Term Debt:
Total Short-Term Liabilities:
Long Term Debt, Non-Current Portion:
Total Long-Term Liabilities:
Total Liabilities:
COMPANY PROFILE
As of December 31, 2021, the Company owned or had ownership interests in 252 operating apartment communities, comprising 61,911 apartment homes, excluding the Company's ownership interests in preferred interest co-investments, loan investments, three operating commercial building, and a development pipeline comprised of one consolidated project and one unconsolidated joint venture project. The operating apartment communities are located in Southern California (primarily Los Angeles, Orange, San Diego, and Ventura counties), Northern California (the San Francisco Bay Area) and the Seattle metropolitan areas.
Free historical financial statements for Essex Property Trust Inc.. See how revenue, income, cash flow, and balance sheet financials have changed over 61 quarters since 2011. Compare with ESS stock chart to see long term trends.
Data imported from Essex Property Trust Inc. SEC filings. Check original filings before making any investment decision.