
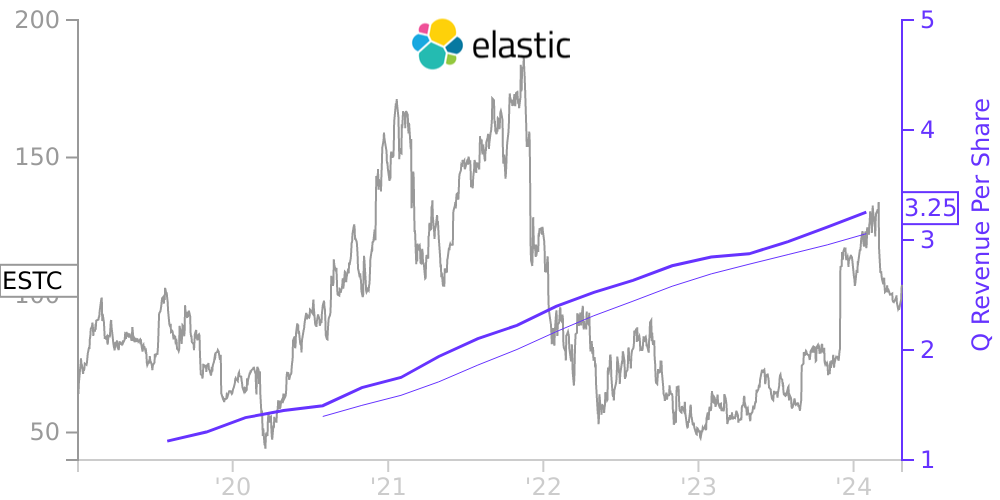
ESTC Stock Price Correlated With Elastic NV Financials
External Links ⌄
Income Statement
Cash Flow
Balance Sheet
ESTC Income Statement
Enable JavaScript and reload
Revenue, Net:
Cost of Goods & Services Sold:
Gross Profit:
Selling, General & Admin Expense:
Research & Development Expense:
Total Operating Expenses:
Operating Income:
Income Taxes:
Net Income:
ESTC Cash Flow
Enable JavaScript and reload
Operating Activities Net Income:
Depreciation, Depletion & Amortization:
Change in Accounts Receiveable:
Net Cash from Operations:
Repurchases/Buybacks Common Stock:
Issuance of Long-term Debt:
Cash Dividends Paid:
Net Cash from Financing Activities:
Property, Plant & Equipment Purchases:
Purchases of Businesses, Net of Cash:
Net Cash from Investing Activities:
Net Change in Cash & Equivalents:
ESTC Balance Sheet
Enable JavaScript and reload
Cash and Cash Equivalents:
Short-Term Investments:
Accounts Receivable, Net:
Inventories:
Total Current Assets:
Property, Plant & Equipment, Net:
Total Assets:
Accounts Payable:
Current Portion of Long-Term Debt:
Total Short-Term Liabilities:
Long Term Debt, Non-Current Portion:
Total Long-Term Liabilities:
Total Liabilities:
COMPANY PROFILE
Organization and Description of Business Elastic N.V. (“Elastic” or the “Company”) was incorporated under the laws of the Netherlands in 2012. Elastic is a search company. It created the Elastic Stack, a powerful set of software products that ingest and store data from any source and in any format, and perform search, analysis, and visualization in milliseconds or less. Developers build on top of the Elastic Stack to apply the power of search to their data and solve business problems. The Company also offers software solutions built on the Elastic Stack: Enterprise Search, Observability, and Security. The Elastic Stack and the Company’s solutions are designed to run in public or private clouds, in hybrid environments, or in traditional on-premises environments.
Initial Public Offering
In October 2018, the Company completed its initial public offering (“IPO”) in which it issued and sold 8,050,000 ordinary shares at an offering price of $36.00 per share, including 1,050,000 ordinary shares pursuant to the exercise in full of the underwriters’ option to purchase additional shares. The Company received net proceeds of $263.8 million, after deducting underwriting discounts and commissions of $20.3 million and offering expenses of $5.7 million. Immediately prior to the completion of the IPO, all 28,939,466 shares of the Company’s then-outstanding redeemable convertible preference shares automatically converted into 28,939,466 ordinary shares at their respective conversion ratios and the Company reclassified $200.6 million from temporary equity to additional paid-in capital and $0.3 million to ordinary shares on its consolidated balance sheet.
The Company’s articles of association designated and authorized the Company to issue 72 million ordinary shares with a par value of €0.001 per share up until immediately prior to the completion of the IPO at which time the authorized ordinary shares increased to 165 million. In addition, the par value of ordinary shares was changed from €0.001 per share to €0.01 per share as required by Dutch law at the time of the Company’s conversion into a Dutch public company with limited liability ( naamloze vennootschap ).
Free historical financial statements for Elastic NV. See how revenue, income, cash flow, and balance sheet financials have changed over 28 quarters since 2019. Compare with ESTC stock chart to see long term trends.
Data imported from Elastic NV SEC filings. Check original filings before making any investment decision.