Consumer Discretionary › Finance Services

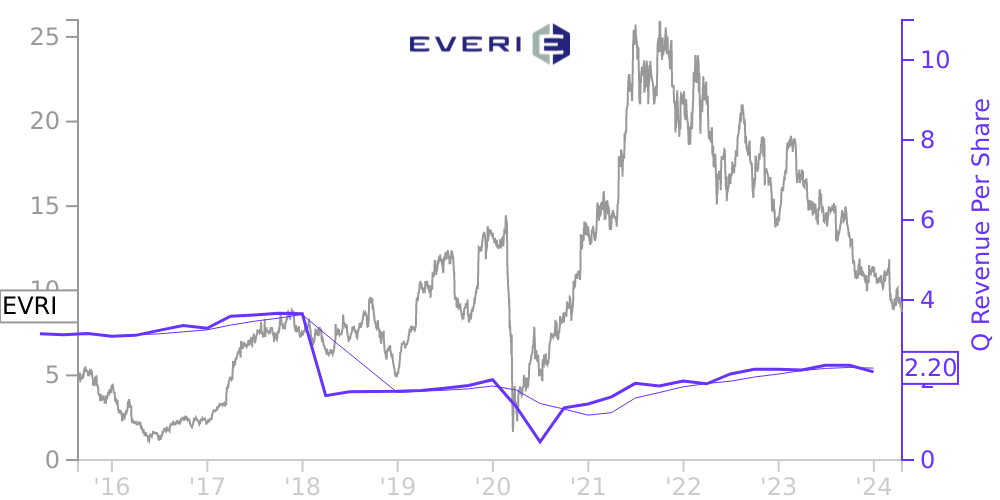
EVRI Stock Price Correlated With Everi Holdings Financials
External Links ⌄
Income Statement
Cash Flow
Balance Sheet
EVRI Income Statement
Enable JavaScript and reload
Revenue, Net:
Cost of Goods & Services Sold:
Gross Profit:
Selling, General & Admin Expense:
Research & Development Expense:
Total Operating Expenses:
Operating Income:
Income Taxes:
Net Income:
EVRI Cash Flow
Enable JavaScript and reload
Operating Activities Net Income:
Depreciation, Depletion & Amortization:
Change in Accounts Receiveable:
Net Cash from Operations:
Repurchases/Buybacks Common Stock:
Issuance of Long-term Debt:
Cash Dividends Paid:
Net Cash from Financing Activities:
Property, Plant & Equipment Purchases:
Purchases of Businesses, Net of Cash:
Net Cash from Investing Activities:
Net Change in Cash & Equivalents:
EVRI Balance Sheet
Enable JavaScript and reload
Cash and Cash Equivalents:
Short-Term Investments:
Accounts Receivable, Net:
Inventories:
Total Current Assets:
Property, Plant & Equipment, Net:
Total Assets:
Accounts Payable:
Current Portion of Long-Term Debt:
Total Short-Term Liabilities:
Long Term Debt, Non-Current Portion:
Total Long-Term Liabilities:
Total Liabilities:
COMPANY PROFILE
1. BUSINESS AND BASIS OF PRESENTATION
Overview
Global Cash Access Holdings, Inc. (“Holdings”) is a holding company, the principal asset of which is the capital stock of Global Cash Access, Inc. (“GCA”). Unless otherwise indicated, the terms “the Company,” “Holdings,” “we,” “us” and “our” refer to Holdings together with its consolidated subsidiaries. Holdings was formed on February 4, 2004 for the purpose of holding all of the outstanding capital stock of GCA and to guarantee the obligations under our senior secured credit facilities.
We are a global provider of cash access and data intelligence services and solutions to the gaming industry. Our services and solutions provide gaming establishment patrons access to cash through a variety of methods, including automated teller machine (“ATM”) cash withdrawals, credit card cash access transactions, point-of-sale (“POS”) debit card transactions, check verification and warranty services and money transfers. In addition, we also provide products and services that improve credit decision-making, automate cashier operations and enhance patron marketing activities for gaming establishments. We also sell and service cash access devices such as slot machine ticket redemption and jackpot kiosks to the gaming industry.
The Company also owns and operates a credit reporting agency for the gaming industry through a wholly-owned subsidiary, Central Credit, LLC (“Central Credit”), which provides credit-information services and credit-reporting history on gaming patrons to various gaming establishments. Central Credit operates in both international and domestic gaming markets. The results of operations of Central Credit have been reflected in other revenues.
In May 2010, we completed the acquisition of Western Money Systems (“Western Money”), a manufacturer of redemption kiosk devices. The results of operations of Western Money have been reflected in other revenues.
In November 2011, we acquired substantially all of the assets of MCA Processing LLC (“MCA”), a provider of ATM, debit card and credit card cash access services to gaming establishments and also a manufacturer, seller, licensor and servicer of redemption kiosk devices.
Basis of Presentation
The unaudited condensed consolidated financial statements included herein have been prepared by the Company pursuant to the rules and regulations of the Securities and Exchange Commission (“SEC”). Some of the information and footnote disclosures normally included in financial statements prepared in accordance with generally accepted accounting principles in the United States have been condensed or omitted pursuant to such rules and regulations, although the Company believes that the disclosures are adequate to make the information presented not misleading. In the opinion of management, all adjustments (which include normal recurring adjustments) necessary for a fair presentation of results for the interim periods have been made. The results for the three months ended March 31, 2012 are not necessarily indicative of results to be expected for the full fiscal year.
These unaudited condensed consolidated financial statements should be read in conjunction with the annual consolidated financial statements and notes thereto included within the Company’s Annual Report on Form 10-K for the year ended December 31, 2011 (the “2011 10-K”).
Use of Estimates
The Company has made estimates and judgments affecting the amounts reported in these financial statements and the accompanying notes. The actual results may differ from these estimates. These accounting estimates incorporated into the Company’s consolidated financial statements include, but are not limited to:
· the estimated reserve for warranty expense associated with our check warranty receivables;
· the valuation and recognition of share-based compensation;
· the valuation allowance on our deferred income tax assets; and
· the estimated cash flows in assessing the recoverability of l
Free historical financial statements for Everi Holdings Inc. See how revenue, income, cash flow, and balance sheet financials have changed over 53 quarters since 2012. Compare with EVRI stock chart to see long term trends.
Data imported from Everi Holdings Inc SEC filings. Check original filings before making any investment decision.