Real Estate › Real Estate Agents And Managers (For Others)

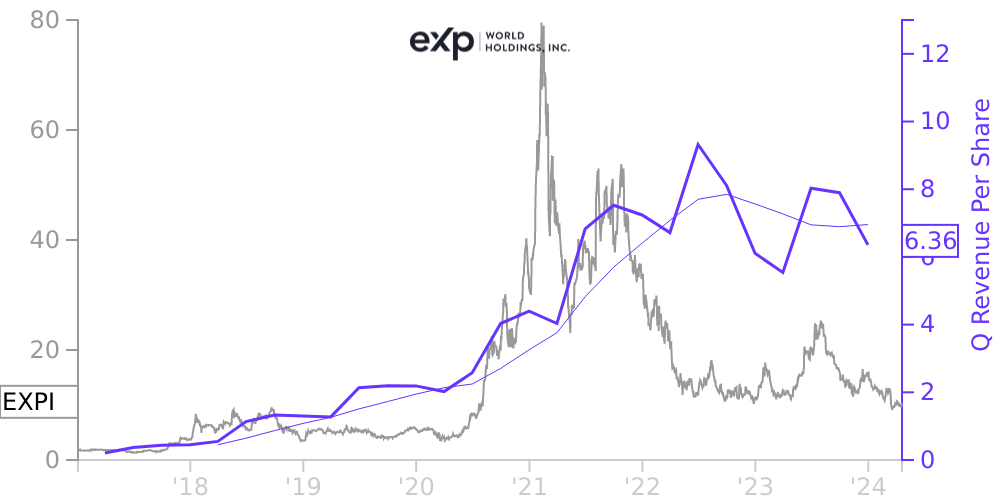
EXPI Stock Price Correlated With eXp World Holdings Financials
External Links ⌄
Income Statement
Cash Flow
Balance Sheet
EXPI Income Statement
Enable JavaScript and reload
Revenue, Net:
Cost of Goods & Services Sold:
Gross Profit:
Selling, General & Admin Expense:
Research & Development Expense:
Total Operating Expenses:
Operating Income:
Income Taxes:
Net Income:
EXPI Cash Flow
Enable JavaScript and reload
Operating Activities Net Income:
Depreciation, Depletion & Amortization:
Change in Accounts Receiveable:
Net Cash from Operations:
Repurchases/Buybacks Common Stock:
Issuance of Long-term Debt:
Cash Dividends Paid:
Net Cash from Financing Activities:
Property, Plant & Equipment Purchases:
Purchases of Businesses, Net of Cash:
Net Cash from Investing Activities:
Net Change in Cash & Equivalents:
EXPI Balance Sheet
Enable JavaScript and reload
Cash and Cash Equivalents:
Short-Term Investments:
Accounts Receivable, Net:
Inventories:
Total Current Assets:
Property, Plant & Equipment, Net:
Total Assets:
Accounts Payable:
Current Portion of Long-Term Debt:
Total Short-Term Liabilities:
Long Term Debt, Non-Current Portion:
Total Long-Term Liabilities:
Total Liabilities:
COMPANY PROFILE
1. DESCRIPTION OF BUSINESS AND BASIS OF PRESENTATION eXp World Holdings, Inc. (collectively with its subsidiaries, the “Company” or “eXp”) was incorporated in the State of Delaware on July 30, 2008. Through various operating subsidiaries, the Company primarily operates a cloud-based real estate brokerage operating throughout the United States, and most of the Canadian provinces. The Company expanded its business into Australia and the United Kingdom in 2019, and into South Africa, India, Mexico, Portugal and France, during 2020 and into Puerto Rico, Brazil, Italy, Hong Kong, Colombia, Spain, Israel, Panama and Germany in 2021. The Company focuses on a number of cloud-based technologies in order to grow an international brokerage without the burden of physical bricks and mortar or redundant staffing costs. The accompanying consolidated financial statements have been prepared in accordance with generally accepted accounting principles and are expressed in U.S. dollars. The Company’s fiscal year end is December 31. Common stock split On January 19, 2021, the Company declared a two -for-one stock split of the Company’s common stock effected in the form of a stock dividend (the “Stock Split”) on each share of the Company’s outstanding Common Stock. The stock dividend was issued on February 12, 2021 to holders of record of the Company’s Common Stock at the close of business on January 29, 2021. All share and per share amounts presented herein have been retroactively adjusted to reflect the impact of the Stock Split. Impact of the Stock Split The impacts of the Stock Split were applied retroactively for all periods presented in accordance with applicable guidance. Therefore, prior period amounts are different from those previously reported. Certain amounts within the following tables may not foot due to rounding. The following table illustrates changes in earnings (loss) per share and weighted average shares outstanding as previously reported prior to, and as adjusted subsequent to, the impact of the Stock Split retroactively adjusted for the years ended 2019: Year ended December 31, 2019 As Previously Reported Impact of Stock Split Revised Weighted average shares outstanding Basic 62,585,555 63,670,852 126,256,407 Diluted 62,585,555 63,670,852 126,256,407 Earnings (loss) per share Basic (0.15) 0.07 (0.08) Diluted (0.15) 0.07 (0.08) The following table illustrates changes in equity as previously reported prior to, and as adjusted subsequent to, the impact of the Stock Split retroactively adjusted for the years ended 2019:
Year ended December 31, 2019 As Previously Reported Impact of Stock Split Revised Common stock: Balance, beginning of year 60,609,102 60,609,102 121,218,204 Retirement of common stock (1,818,273) (1,818,273) (3,636,546) Shares issued for acquisition - - - Shares issued for stock options exercised 2,261,122 2,261,122 4,522,244 Agent growth incentive stock compensation 1,345,754 1,345,754 2,691,508 Agent equity stock compensation 3,801,603 3,801,603 7,603,206 Balance, end of year 66,199,308 66,199,308 132,398,616 Common stock, par value (1) $ 1 $ - $ 1
(1) The par value of common stock changed by less than one thousand dollars and shows no impact due to rounding. Stock awards under the Company’s equity incentive program for agents were adjusted retroactively to give effect to the Stock Split retroactively adjusted for the following periods:
Shares Weighted Average Grant Date Fair Value As Previously Reported Impact of Stock Split Revised As Previously Reported Impact of Stock Split Revised Balance, December 31, 2018 3,872,877 3,872,877 7,745,754 $ 11.63 ($ 5.82) $ 5.82 Granted 1,687,457 1,687,457 3,374,914 9.23 (4.62) 4.62 Vested and issued
Free historical financial statements for eXp World Holdings Inc.. See how revenue, income, cash flow, and balance sheet financials have changed over 43 quarters since 2016. Compare with EXPI stock chart to see long term trends.
Data imported from eXp World Holdings Inc. SEC filings. Check original filings before making any investment decision.