Industrials › Services-Management Consulting Services

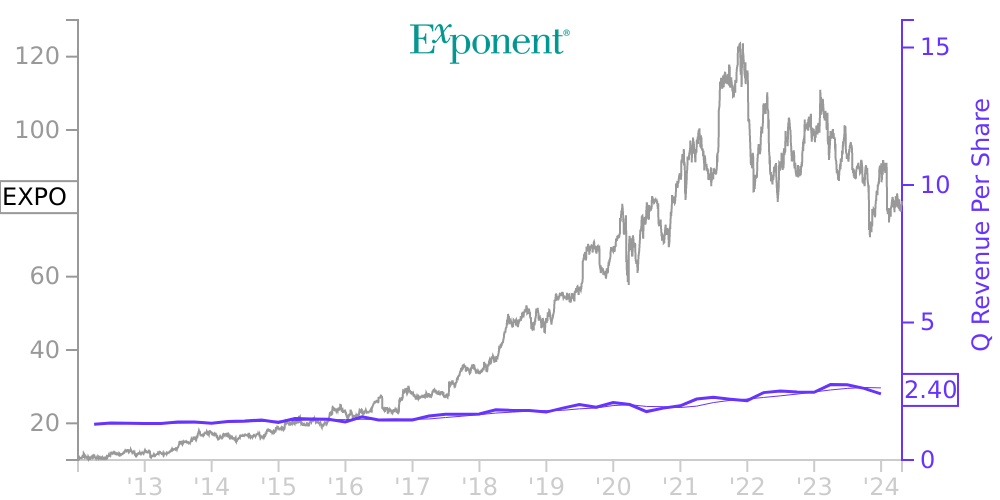
EXPO Stock Price Correlated With Exponent Financials
External Links ⌄
Income Statement
Cash Flow
Balance Sheet
EXPO Income Statement
Enable JavaScript and reload
Revenue, Net:
Cost of Goods & Services Sold:
Gross Profit:
Selling, General & Admin Expense:
Research & Development Expense:
Total Operating Expenses:
Operating Income:
Income Taxes:
Net Income:
EXPO Cash Flow
Enable JavaScript and reload
Operating Activities Net Income:
Depreciation, Depletion & Amortization:
Change in Accounts Receiveable:
Net Cash from Operations:
Repurchases/Buybacks Common Stock:
Issuance of Long-term Debt:
Cash Dividends Paid:
Net Cash from Financing Activities:
Property, Plant & Equipment Purchases:
Purchases of Businesses, Net of Cash:
Net Cash from Investing Activities:
Net Change in Cash & Equivalents:
EXPO Balance Sheet
Enable JavaScript and reload
Cash and Cash Equivalents:
Short-Term Investments:
Accounts Receivable, Net:
Inventories:
Total Current Assets:
Property, Plant & Equipment, Net:
Total Assets:
Accounts Payable:
Current Portion of Long-Term Debt:
Total Short-Term Liabilities:
Long Term Debt, Non-Current Portion:
Total Long-Term Liabilities:
Total Liabilities:
COMPANY PROFILE
Note 1: Basis of Presentation
Exponent, Inc. (referred to as the “Company” or “Exponent”) is an engineering and scientific consulting firm that provides solutions to complex problems. The Company operates on a 52-53 week fiscal year ending on the Friday closest to the last day of December.
The accompanying unaudited condensed consolidated financial statements are prepared in accordance with accounting principles generally accepted in the United States of America for interim financial information, the instructions to Form 10-Q and Article 10 of Regulation S-X promulgated by the U.S. Securities and Exchange Commission. Accordingly, they do not contain all the information and notes required by accounting principles generally accepted in the United States of America for complete financial statements. In the opinion of management, all adjustments which are necessary for the fair presentation of the condensed consolidated financial statements have been included and all such adjustments are of a normal and recurring nature. The operating results for the three months ended April 1, 2022 are not necessarily representative of the results of future quarterly or annual periods. The following information should be read in conjunction with the audited consolidated financial statements and accompanying notes thereto included in the Company’s Annual Report on Form 10-K for the fiscal year ended December 31, 2021, which was filed with the U.S. Securities and Exchange Commission on February 25, 2022.
The unaudited condensed consolidated financial statements include the accounts of Exponent, Inc. and its subsidiaries, which are all wholly owned. All intercompany accounts and transactions have been eliminated in consolidation.
Use of Estimates. The preparation of financial statements in conformity with accounting principles generally accepted in the United States of America requires management to make estimates and assumptions that affect the reported amounts of assets and liabilities and disclosure of contingent assets and liabilities at the date of the financial statements and the reported amounts of revenues and expenses during the period. Items subject to such estimates and assumptions include accounting for revenue recognition and estimating the allowance for contract losses and doubtful accounts. Actual results could differ from those estimates.
Free historical financial statements for Exponent Inc. See how revenue, income, cash flow, and balance sheet financials have changed over 57 quarters since 2012. Compare with EXPO stock chart to see long term trends.
Data imported from Exponent Inc SEC filings. Check original filings before making any investment decision.