Consumer Discretionary › Motor Vehicles And Passenger Car Bodies

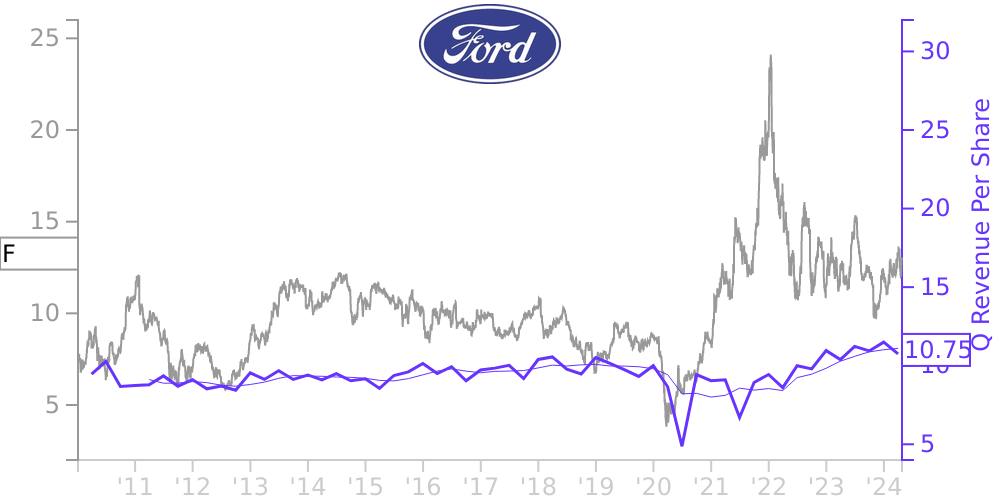
F Stock Price Correlated With Ford Motor Co Financials
External Links ⌄
Income Statement
Cash Flow
Balance Sheet
F Income Statement
Enable JavaScript and reload
Revenue, Net:
Cost of Goods & Services Sold:
Gross Profit:
Selling, General & Admin Expense:
Research & Development Expense:
Total Operating Expenses:
Operating Income:
Income Taxes:
Net Income:
F Cash Flow
Enable JavaScript and reload
Operating Activities Net Income:
Depreciation, Depletion & Amortization:
Change in Accounts Receiveable:
Net Cash from Operations:
Repurchases/Buybacks Common Stock:
Issuance of Long-term Debt:
Cash Dividends Paid:
Net Cash from Financing Activities:
Property, Plant & Equipment Purchases:
Purchases of Businesses, Net of Cash:
Net Cash from Investing Activities:
Net Change in Cash & Equivalents:
F Balance Sheet
Enable JavaScript and reload
Cash and Cash Equivalents:
Short-Term Investments:
Accounts Receivable, Net:
Inventories:
Total Current Assets:
Property, Plant & Equipment, Net:
Total Assets:
Accounts Payable:
Current Portion of Long-Term Debt:
Total Short-Term Liabilities:
Long Term Debt, Non-Current Portion:
Total Long-Term Liabilities:
Total Liabilities:
COMPANY PROFILE
PRESENTATION For purposes of this report, “Ford,” the “Company,” “we,” “our,” “us,” or similar references mean Ford Motor Company, our consolidated subsidiaries, and our consolidated VIEs of which we are the primary beneficiary, unless the context requires otherwise. We also make reference to Ford Motor Credit Company LLC, herein referenced to as Ford Credit. Our consolidated financial statements are presented in accordance with U.S. generally accepted accounting principles (“GAAP”). We reclassified certain prior year amounts in our consolidated financial statements to conform to the current year presentation.
Certain Transactions Between Automotive, Mobility, and Ford Credit
Intersegment transactions occur in the ordinary course of business. Additional detail regarding certain transactions and the effect on each segment at December 31 was as follows (in billions): 2020 2021 Automotive Mobility Ford Credit Automotive Mobility Ford Credit Trade and other receivables (a) $ 5.9 $ 7.4 Unearned interest supplements and residual support (b) (6.5) (4.6) Finance receivables and other (c) 1.5 1.2 Intersegment receivables/(payables) $ (2.7) $ — 2.7 $ (1.4) $ — 1.4 __________
(a) Automotive receivables (generated primarily from vehicle and parts sales to third parties) sold to Ford Credit.
(b) Automotive pays amounts to Ford Credit at the point of retail financing or lease origination, which represent interest supplements and residual support.
(c)Primarily receivables with entities that are consolidated subsidiaries of Ford, including a sale-leaseback agreement between Automotive and Ford Credit relating primarily to vehicles that we lease to our employees.
Free historical financial statements for Ford Motor Co.. See how revenue, income, cash flow, and balance sheet financials have changed over 65 quarters since 2010. Compare with F stock chart to see long term trends.
Data imported from Ford Motor Co. SEC filings. Check original filings before making any investment decision.