Technology › Measuring And Controlling Devices, Nec

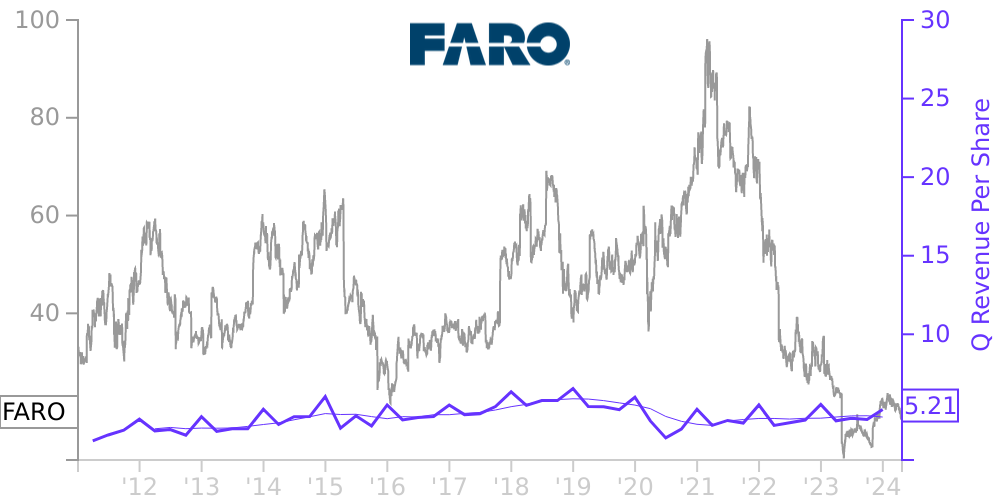
FARO Stock Price Correlated With FARO Technologies Financials
External Links ⌄
Income Statement
Cash Flow
Balance Sheet
FARO Income Statement
Enable JavaScript and reload
Revenue, Net:
Cost of Goods & Services Sold:
Gross Profit:
Selling, General & Admin Expense:
Research & Development Expense:
Total Operating Expenses:
Operating Income:
Income Taxes:
Net Income:
FARO Cash Flow
Enable JavaScript and reload
Operating Activities Net Income:
Depreciation, Depletion & Amortization:
Change in Accounts Receiveable:
Net Cash from Operations:
Repurchases/Buybacks Common Stock:
Issuance of Long-term Debt:
Cash Dividends Paid:
Net Cash from Financing Activities:
Property, Plant & Equipment Purchases:
Purchases of Businesses, Net of Cash:
Net Cash from Investing Activities:
Net Change in Cash & Equivalents:
FARO Balance Sheet
Enable JavaScript and reload
Cash and Cash Equivalents:
Short-Term Investments:
Accounts Receivable, Net:
Inventories:
Total Current Assets:
Property, Plant & Equipment, Net:
Total Assets:
Accounts Payable:
Current Portion of Long-Term Debt:
Total Short-Term Liabilities:
Long Term Debt, Non-Current Portion:
Total Long-Term Liabilities:
Total Liabilities:
COMPANY PROFILE
PRINCIPLES OF CONSOLIDATIONOur condensed consolidated financial statements include the accounts of FARO Technologies, Inc. and its subsidiaries, all of which are wholly owned. All intercompany transactions and balances have been eliminated. The financial statements of our foreign subsidiaries are translated into U.S. dollars using exchange rates in effect at period-end for assets and liabilities and average exchange rates during each reporting period for results of operations. Adjustments resulting from financial statement translations are reflected as a separate component of accumulated other comprehensive loss. Foreign currency transaction gains and losses are included in net loss
Free historical financial statements for FARO Technologies Inc.. See how revenue, income, cash flow, and balance sheet financials have changed over 57 quarters since 2011. Compare with FARO stock chart to see long term trends.
Data imported from FARO Technologies Inc. SEC filings. Check original filings before making any investment decision.