Industrials › Air Courier Services

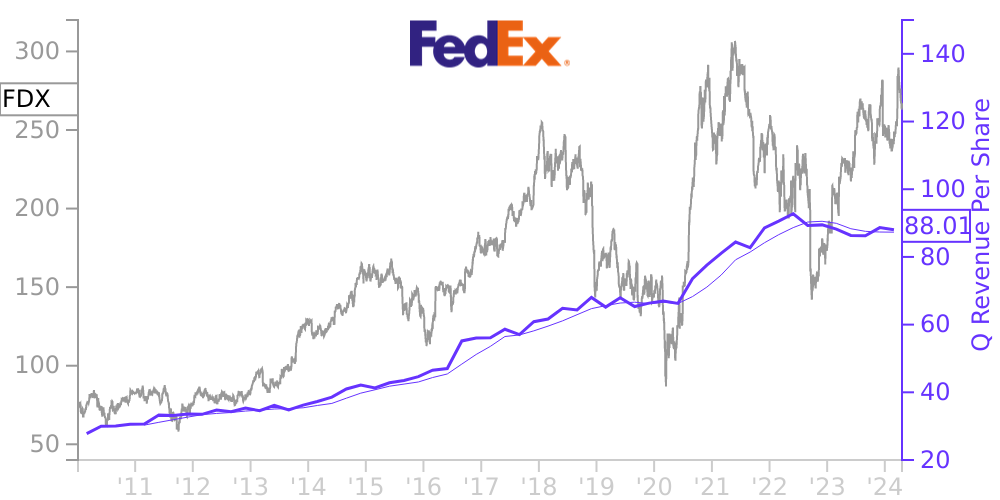
FDX Stock Price Correlated With FedEx Financials
External Links ⌄
Income Statement
Cash Flow
Balance Sheet
FDX Income Statement
Enable JavaScript and reload
Revenue, Net:
Cost of Goods & Services Sold:
Gross Profit:
Selling, General & Admin Expense:
Research & Development Expense:
Total Operating Expenses:
Operating Income:
Income Taxes:
Net Income:
FDX Cash Flow
Enable JavaScript and reload
Operating Activities Net Income:
Depreciation, Depletion & Amortization:
Change in Accounts Receiveable:
Net Cash from Operations:
Repurchases/Buybacks Common Stock:
Issuance of Long-term Debt:
Cash Dividends Paid:
Net Cash from Financing Activities:
Property, Plant & Equipment Purchases:
Purchases of Businesses, Net of Cash:
Net Cash from Investing Activities:
Net Change in Cash & Equivalents:
FDX Balance Sheet
Enable JavaScript and reload
Cash and Cash Equivalents:
Short-Term Investments:
Accounts Receivable, Net:
Inventories:
Total Current Assets:
Property, Plant & Equipment, Net:
Total Assets:
Accounts Payable:
Current Portion of Long-Term Debt:
Total Short-Term Liabilities:
Long Term Debt, Non-Current Portion:
Total Long-Term Liabilities:
Total Liabilities:
COMPANY PROFILE
(1) General SUMMARY OF SIGNIFICANT ACCOUNTING POLICIES. These interim financial statements of FedEx Corporation (“FedEx”) have been prepared in accordance with accounting principles generally accepted in the United States and Securities and Exchange Commission (“SEC”) instructions for interim financial information, and should be read in conjunction with our Annual Report on Form 10-K for the year ended May 31, 2022 (“Annual Report”). Significant accounting policies and other disclosures normally provided have been omitted since such items are disclosed in our Annual Report. In the opinion of management, the accompanying unaudited condensed consolidated financial statements reflect all adjustments (including normal recurring adjustments) necessary to present fairly our financial position as of August 31, 2022, and the results of our operations for the three-month periods ended August 31, 2022 and 2021, cash flows for the three-month periods ended August 31, 2022 and 2021, and changes in common stockholders’ investment for the three-month periods ended August 31, 2022 and 2021. Operating results for the three-month period ended August 31, 2022 are not necessarily indicative of the results that may be expected for the year ending May 31, 2023. Except as otherwise specified, references to years indicate our fiscal year ending May 31, 2023 or ended May 31 of the year referenced and comparisons are to the corresponding period of the prior year.
REVENUE RECOGNITION . Contract Assets and Liabilities Contract assets include billed and unbilled amounts resulting from in-transit shipments, as we have an unconditional right to payment only once all performance obligations have been completed (e.g., packages have been delivered). Contract assets are generally classified as current, and the full balance is converted each quarter based on the short-term nature of the transactions. Our contract liabilities consist of advance payments and billings in excess of revenue. The full balance of deferred revenue is converted each quarter based on the short-term nature of the transactions. Gross contract assets related to in-transit shipments total ed $ 774 million and $ 861 million at August 31, 2022 and May 31, 2022, respectively. Contract assets net of deferred unearned revenue we re $ 556 million and $ 623 million at August 31, 2022 and May 31, 2022, respectively. Contract assets are included within current assets in the accompanying unaudited condensed consolidated balance sheets. Contract liabilities related to advance payments from customer s were $ 14 million a nd $ 8 million at August 31, 2022 and May 31, 2022, respectively. Contract liabilities are included within current liabilities in the accompanying unaudited condensed consolidated balance sheets. Disaggregation of Revenue The following table provides revenue by service type (in millions) for the periods ended August 31. This presentation is consistent with how we organize our segments internally for making operating decisions and measuring performance.
Three Months Ended
2022
2021
REVENUE BY SERVICE TYPE
FedEx Express segment:
Package:
U.S. overnight box
$
2,316
$
2,170
U.S. overnight envelope
525
482
U.S. deferred
1,287
1,231
Total U.S. domestic package revenue
4,128
3,883
International priority
2,897
2,839
International economy
707
669
Total international export package revenue
3,604
3,508
International domestic (1)
974
1,114
Total package revenue
8,706
8,505
Freight:
U.S.
796
775
International priority
888
873
International economy
377
414
International airfreight
41
47
Total freight revenue
2,102
2,109
Other
319
352
Total FedEx Express segment
11,127
10,966
FedEx Ground segment
8,160
7,677
FedEx Freight segment
2,723
2,251
FedEx Services segment
70
35
Other and eliminations (2)
1,162
1,074
$
23,242
$
22,003
(1) International domestic revenue relates to our international intra-country operations.
(2) Includes the
Free historical financial statements for FedEx Corp.. See how revenue, income, cash flow, and balance sheet financials have changed over 68 quarters since 2009. Compare with FDX stock chart to see long term trends.
Data imported from FedEx Corp. SEC filings. Check original filings before making any investment decision.