Technology › Instruments For Meas And Testing Of Electricity And Elec Signals

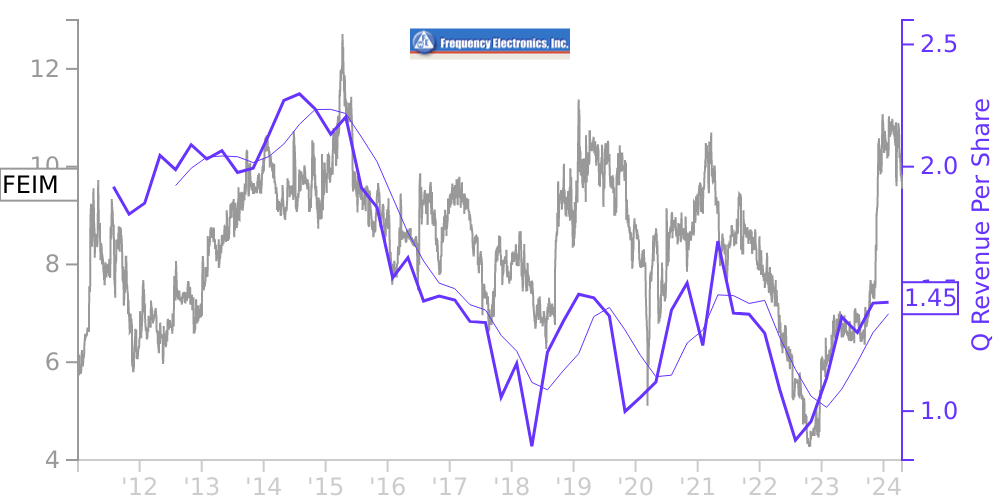
FEIM Stock Price Correlated With Frequency Electronics Financials
External Links ⌄
Income Statement
Cash Flow
Balance Sheet
FEIM Income Statement
Enable JavaScript and reload
Revenue, Net:
Cost of Goods & Services Sold:
Gross Profit:
Selling, General & Admin Expense:
Research & Development Expense:
Total Operating Expenses:
Operating Income:
Income Taxes:
Net Income:
FEIM Cash Flow
Enable JavaScript and reload
Operating Activities Net Income:
Depreciation, Depletion & Amortization:
Change in Accounts Receiveable:
Net Cash from Operations:
Repurchases/Buybacks Common Stock:
Issuance of Long-term Debt:
Cash Dividends Paid:
Net Cash from Financing Activities:
Property, Plant & Equipment Purchases:
Purchases of Businesses, Net of Cash:
Net Cash from Investing Activities:
Net Change in Cash & Equivalents:
FEIM Balance Sheet
Enable JavaScript and reload
Cash and Cash Equivalents:
Short-Term Investments:
Accounts Receivable, Net:
Inventories:
Total Current Assets:
Property, Plant & Equipment, Net:
Total Assets:
Accounts Payable:
Current Portion of Long-Term Debt:
Total Short-Term Liabilities:
Long Term Debt, Non-Current Portion:
Total Long-Term Liabilities:
Total Liabilities:
COMPANY PROFILE
NOTE A – CONDENSED CONSOLIDATED FINANCIAL STATEMENTS In the opinion of management of Frequency Electronics, Inc. (the “Company”), the accompanying unaudited condensed consolidated interim financial statements reflect all adjustments (which include only normal recurring adjustments) necessary to present fairly, in all material respects, the condensed consolidated financial position of the Company as of July 31, 2022 and the results of its operations, changes in stockholders’ equity for the three months ended July 31, 2022 and 2021, and cash flows for the three months ended July 31, 2022 and 2021. The April 30, 2022 condensed consolidated balance sheet was derived from audited financial statements. These financial statements are prepared in conformity with accounting principles generally accepted in the United States of America (“U.S. GAAP’). Certain information and footnote disclosures normally included in financial statements prepared in accordance with U.S. GAAP have been condensed or omitted. These condensed consolidated interim financial statements should be read in conjunction with the annual consolidated financial statements included in the Company’s Annual Report on Form 10-K for the fiscal year ended April 30, 2022, filed on July 14, 2022 with the Securities and Exchange Commission (the “Form 10-K”). The results of operations for such interim periods are not necessarily indicative of the operating results for the full fiscal year. COVID-19 Pandemic, and Other Macroeconomic Factors The full impact of the COVID-19 pandemic continues to evolve as of the date of this report. As such, it is uncertain as to the full magnitude that the pandemic may ultimately have on the Company’s financial condition, liquidity, and future financial results. For the three months ended July 31, 2022, the Company has been impacted by employee absenteeism related to direct or indirect effects of the COVID-19 pandemic, delays in the receipt of anticipated new contracts from customers administratively affected by the pandemic and limited availability or delivery delays of parts and materials from vendors affected by the pandemic. FEI-Zyfer’s operations were particularly affected as evidenced by decreases in sales and gross margin during fiscal year 2022, which continued during the three months ended July 31, 2022. Management is actively monitoring the impact of the global situation on its financial condition, liquidity, operations, suppliers, industry, and workforce. Given the continuing changing dynamics of the COVID-19 pandemic the Company is not able to estimate the potential adverse effects on its operations, financial condition, or liquidity for the remainder of fiscal year 2023. As of July 31, 2022, the Company has returned to essentially normal operations and will continue to follow federal and state guidelines with an emphasis on employee safety. The Company faces various future COVID-19 related risks, and risks resulting from geopolitical conflicts. The Company is dependent on its workforce to design and manufacture its products. If significant portions of the Company’s workforce are unable to work effectively, or if the U.S. Government, state and/or other customers or supplier operations are curtailed due to illness, quarantines, government actions, facility closures, or other restrictions, the Company’s operations may be negatively impacted. If faced with any of these factors, the Company may be unable to perform fully on its contracts and costs may increase. These cost increases may not be fully recoverable or adequately covered by insurance. Due to continuing geopolitical circumstances resulting in increased inflation, energy and commodity prices may continue escalating which may adversely affect the Company’s financial results. Also, certain Company vendors have been unable to deliver materials on time due to COVID-19 related impacts to their workforces or their supply chains. These delays impacted the Company’s production costs and s
Free historical financial statements for Frequency Electronics Inc. See how revenue, income, cash flow, and balance sheet financials have changed over 60 quarters since 2011. Compare with FEIM stock chart to see long term trends.
Data imported from Frequency Electronics Inc SEC filings. Check original filings before making any investment decision.