Industrials › Heavy Construction Other Than Building Const - Contractors

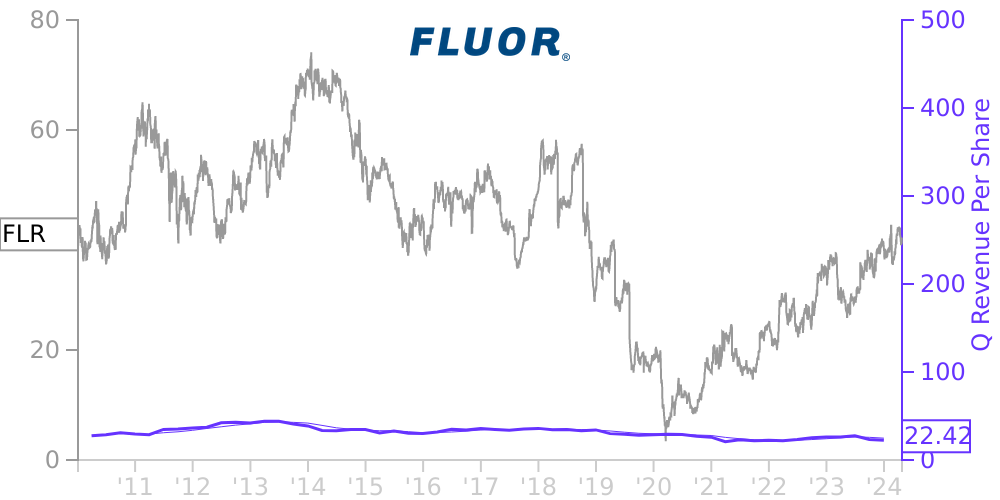
FLR Stock Price Correlated With Fluor Financials
External Links ⌄
Income Statement
Cash Flow
Balance Sheet
FLR Income Statement
Enable JavaScript and reload
Revenue, Net:
Cost of Goods & Services Sold:
Gross Profit:
Selling, General & Admin Expense:
Research & Development Expense:
Total Operating Expenses:
Operating Income:
Income Taxes:
Net Income:
FLR Cash Flow
Enable JavaScript and reload
Operating Activities Net Income:
Depreciation, Depletion & Amortization:
Change in Accounts Receiveable:
Net Cash from Operations:
Repurchases/Buybacks Common Stock:
Issuance of Long-term Debt:
Cash Dividends Paid:
Net Cash from Financing Activities:
Property, Plant & Equipment Purchases:
Purchases of Businesses, Net of Cash:
Net Cash from Investing Activities:
Net Change in Cash & Equivalents:
FLR Balance Sheet
Enable JavaScript and reload
Cash and Cash Equivalents:
Short-Term Investments:
Accounts Receivable, Net:
Inventories:
Total Current Assets:
Property, Plant & Equipment, Net:
Total Assets:
Accounts Payable:
Current Portion of Long-Term Debt:
Total Short-Term Liabilities:
Long Term Debt, Non-Current Portion:
Total Long-Term Liabilities:
Total Liabilities:
COMPANY PROFILE
Principles of Consolidation These financial statements do not include footnotes and certain financial information presented annually under GAAP, and therefore, should be read in conjunction with our 2021 10-K. Accounting measurements at interim dates inherently involve greater reliance on estimates than at year-end. Although such estimates are based on management’s most recent assessment of the underlying facts and circumstances utilizing the most current information available, our reported results of operations may not necessarily be indicative of results that we expect for the full year.
The financial statements included herein are unaudited. We believe they contain all adjustments of a normal recurring nature which are necessary to present fairly our financial position and our operating results as of and for the periods presented. All significant intercompany transactions of consolidated subsidiaries are eliminated. Certain amounts in tables may not total or agree back to the financial statements due to immaterial rounding differences. Management has evaluated all material events occurring subsequent to March 31, 2022 through the filing date of this Q1 2022 10-Q.
Quarters are typically 13 weeks in length but, due to our December 31 year-end, the number of weeks in a reporting period may vary slightly during the year and for comparable prior year periods. We report our quarterly results of operations based on periods ending on the Sunday nearest March 31, June 30 and September 30, allowing for 13-week interim reporting periods. For clarity of presentation, all periods are labeled as if the periods ended on March 31, June 30 and September 30.
In the first quarter of 2022, we determined that our Stork business and remaining AMECO equipment business no longer met all of the requirements to be classified as Disc Ops as a result of uncertainties related to the timing of the planned sale. Therefore, both Stork and the remaining AMECO business are reported as Cont Ops for all periods presented and included in our Other segment. Further, we have remeasured the carrying value of these businesses under the held and used criteria and reversed $63 million of previously recorded impairment expense.
Free historical financial statements for Fluor Corp. See how revenue, income, cash flow, and balance sheet financials have changed over 69 quarters since 2009. Compare with FLR stock chart to see long term trends.
Data imported from Fluor Corp SEC filings. Check original filings before making any investment decision.