Industrials › Services-Engineering, Accounting, Research, Management

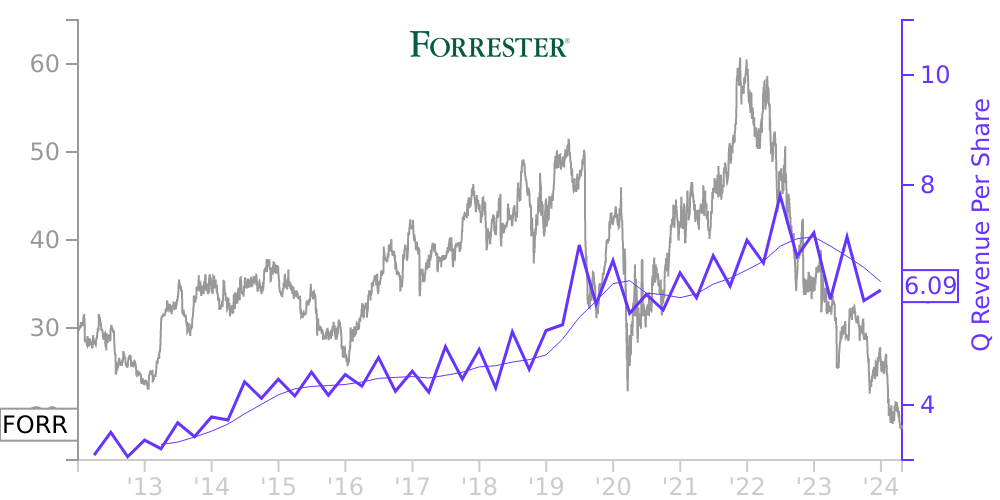
FORR Stock Price Correlated With Forrester Research Financials
External Links ⌄
Income Statement
Cash Flow
Balance Sheet
FORR Income Statement
Enable JavaScript and reload
Revenue, Net:
Cost of Goods & Services Sold:
Gross Profit:
Selling, General & Admin Expense:
Research & Development Expense:
Total Operating Expenses:
Operating Income:
Income Taxes:
Net Income:
FORR Cash Flow
Enable JavaScript and reload
Operating Activities Net Income:
Depreciation, Depletion & Amortization:
Change in Accounts Receiveable:
Net Cash from Operations:
Repurchases/Buybacks Common Stock:
Issuance of Long-term Debt:
Cash Dividends Paid:
Net Cash from Financing Activities:
Property, Plant & Equipment Purchases:
Purchases of Businesses, Net of Cash:
Net Cash from Investing Activities:
Net Change in Cash & Equivalents:
FORR Balance Sheet
Enable JavaScript and reload
Cash and Cash Equivalents:
Short-Term Investments:
Accounts Receivable, Net:
Inventories:
Total Current Assets:
Property, Plant & Equipment, Net:
Total Assets:
Accounts Payable:
Current Portion of Long-Term Debt:
Total Short-Term Liabilities:
Long Term Debt, Non-Current Portion:
Total Long-Term Liabilities:
Total Liabilities:
COMPANY PROFILE
Note 1 — Interim Consolidated Financial Statements Basis of Presentation The accompanying unaudited interim consolidated financial statements have been prepared in accordance with generally accepted accounting principles in the United States of America (“GAAP”) for interim financial information and pursuant to the rules and regulations of the Securities and Exchange Commission (“SEC”) for reporting on Form 10-Q. Accordingly, certain information and footnote disclosures required for complete financial statements are not included herein. The year-end balance sheet data was derived from audited financial statements, but does not include all disclosures required by GAAP. It is recommended that these financial statements be read in conjunction with the consolidated financial statements and related notes that appear in the Forrester Research, Inc. (“Forrester”) Annual Report on Form 10-K for the year ended December 31, 2021. In the opinion of management, all adjustments (consisting of normal recurring adjustments) considered necessary for a fair statement of the financial position, results of operations, comprehensive income, and cash flows as of the dates and for the periods presented have been included. The results of operations for the three months ended March 31, 2022 may not be indicative of the results for the year ending December 31, 2022 , or any other period.
Presentation of Restricted Cash The following table summarizes the end-of-period cash and cash equivalents from the Company's Consolidated Balance Sheets and the total cash, cash equivalents and restricted cash as presented on the accompanying Consolidated Statements of Cash Flows (in thousands).
Three Months Ended March 31,
2022
2021
Cash and cash equivalents
$
112,496
$
125,600
Restricted cash classified in (1):
Prepaid expenses and other current assets
—
360
Other assets
2,199
2,306
Cash, cash equivalents and restricted cash shown in statement of cash flows
$
114,695
$
128,266
(1) Restricted cash consists of collateral required for leased office space, and for the three months ended March 31, 2021, also included an amount for credit card processing outside of the U.S. The short-term or long-term classification regarding the collateral for the leased office space is determined in accordance with the expiration of the underlying leases.
Adoption of New Accounting Pronouncements The Company adopted the guidance in the Financial Accounting Standards Board’s (“FASB”) Accounting Standards Update (“ASU”) No. 2019-12, Income Taxes – Simplifying the Accounting for Income Taxes on January 1, 2021 . The standard provides guidance to simplify the accounting for income taxes in certain areas, changes the accounting for select income tax transactions, and makes other minor improvements. The adoption of this standard did not have a material impact on the Company’s financial position or results of operations. Recent Accounting Pronouncements In March 2020, the FASB issued ASU No. 2020-04, Reference Rate Reform (Topic 848) – Facilitation of the Effects of Reference Rate Reform on Finance Reporting . The new standard provides optional guidance for a limited period of time to ease the potential burden in accounting for, or recognizing the effects of, reference rate reform on financial reporting due to the risk of cessation of the London Interbank Offered Rate (“LIBOR”). The updates apply to contracts, hedging relationships, and other transactions that reference LIBOR, or another reference rate expected to be discontinued because of reference rate reform, and as a result require a modification. An entity may elect to apply the amendments immediately or at any point through December 31, 2022. The adoption of this standard will not have a material impact on the Company’s financial position or results of operations as the Company's only interest rate swap, which is based on LIBOR, will terminate prior to the cessation of LIBOR.
Free historical financial statements for Forrester Research Inc. See how revenue, income, cash flow, and balance sheet financials have changed over 57 quarters since 2012. Compare with FORR stock chart to see long term trends.
Data imported from Forrester Research Inc SEC filings. Check original filings before making any investment decision.