Materials › Miscellaneous Chemical Products

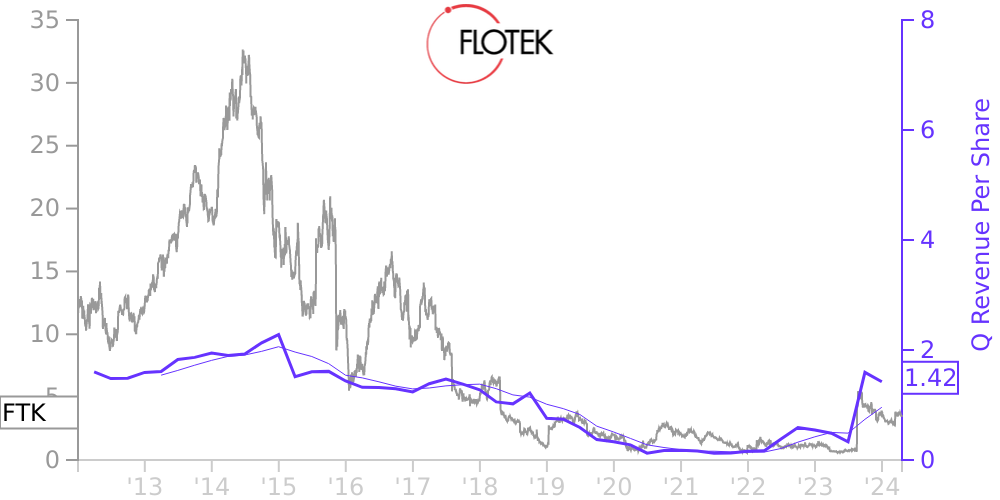
FTK Stock Price Correlated With Flotek Industries Financials
External Links ⌄
Income Statement
Cash Flow
Balance Sheet
FTK Income Statement
Enable JavaScript and reload
Revenue, Net:
Cost of Goods & Services Sold:
Gross Profit:
Selling, General & Admin Expense:
Research & Development Expense:
Total Operating Expenses:
Operating Income:
Income Taxes:
Net Income:
FTK Cash Flow
Enable JavaScript and reload
Operating Activities Net Income:
Depreciation, Depletion & Amortization:
Change in Accounts Receiveable:
Net Cash from Operations:
Repurchases/Buybacks Common Stock:
Issuance of Long-term Debt:
Cash Dividends Paid:
Net Cash from Financing Activities:
Property, Plant & Equipment Purchases:
Purchases of Businesses, Net of Cash:
Net Cash from Investing Activities:
Net Change in Cash & Equivalents:
FTK Balance Sheet
Enable JavaScript and reload
Cash and Cash Equivalents:
Short-Term Investments:
Accounts Receivable, Net:
Inventories:
Total Current Assets:
Property, Plant & Equipment, Net:
Total Assets:
Accounts Payable:
Current Portion of Long-Term Debt:
Total Short-Term Liabilities:
Long Term Debt, Non-Current Portion:
Total Long-Term Liabilities:
Total Liabilities:
COMPANY PROFILE
Organization and Nature of Operations General
Flotek Industries, Inc. (“Flotek” or the “Company”) creates solutions to reduce the environmental impact of energy on air, water, land and people. A technology-driven, specialty green chemistry and data company, Flotek helps customers across industrial, commercial, and consumer markets improve their environmental performance.
The Company’s Chemistry Technologies (“CT”) segment develops, manufactures, packages, distributes, delivers, and markets green specialty chemicals that enhance the profitability of hydrocarbon producers and cleans surfaces in both commercial and personal settings to help reduce the spread of bacteria, viruses and germs.
The Company’s Data Analytics (“DA”) segment enables users to maximize the value of their hydrocarbon associated processes by providing analytics associated with their hydrocarbon streams in seconds rather than minutes or days. The real-time access to information prevents waste, reduces reprocessing and allows users to pursue automation of their hydrocarbon streams to maximize their profitability, while reducing their carbon footprint, energy consumption and emissions.
The Company formed the DA segment during the second quarter of 2020, after acquiring JP3 Measurement, LLC (“JP3”). The Company’s two operating segments, CT and DA, are both supported by its Research & Innovation advanced laboratory capabilities. For further discussion of our operations and segments, see Note 21, “Business Segment, Geographic and Major Customer Information.” For further discussion of the JP3 acquisition, see Note 3, “Business Acquisition.”
The Company was initially incorporated under the laws of the Province of British Columbia in 1985. In October 2001, the Company changed its corporate domicile to the State of Delaware.
Sources and Uses of Liquidity
The Company currently funds its operations and growth primarily from cash on hand. The ability of the Company to grow and be competitive in the marketplace is dependent on the availability of adequate capital. Access to capital is dependent on the Company’s operating cash flows, the monetization of non-core assets, and the availability of and access to debt and equity financing. The Company has a history of losses and negative cash flows from operations and expects to utilize a significant amount of cash in the following year. While we believe that our cash and liquid assets, including the actions taken subsequent to year end discussed below and in Note 22, “Subsequent Events”, will provide us with sufficient financial resources to fund operations and meet our capital requirements and anticipated obligations as they become due, uncertainty surrounding the long term stability and strength of the oil and gas markets or reduced spending by our customers could have a further negative impact on our liquidity.
On February 2, 2022, the Company completed a Private Investment in Public Equity (PIPE) transaction with a consortium of investors, including related parties, through the issuance of $21.2 million aggregate of convertible notes that resulted in net cash proceeds of approximately $19.5 million. Also, on February 2, 2022, the Company entered into a long-term supply agreement with ProFrac Services, LLC (the “ProFrac Agreement”) upon issuance of $10 million of convertible notes. Under the ProFrac Agreement, ProFrac Services, LLC is obligated to order chemicals from the Company at least equal to the greater of (a) the chemicals required for 33% of their hydraulic fracturing fleets and (b) a baseline measured by the first ten hydraulic fracturing fleets deployed by ProFrac Services, LLC. Profrac shall pay to the company, as liquidated damages an amount equal to twenty-five percent (25%) of the difference between (i) the aggregate Purchase Price of the quantity of Products comprising the Minimum Purchase Obligation during such calendar year. The term of the ProFrac Agreement is three years starting on April 1, 20
Free historical financial statements for Flotek Industries Inc. See how revenue, income, cash flow, and balance sheet financials have changed over 57 quarters since 2012. Compare with FTK stock chart to see long term trends.
Data imported from Flotek Industries Inc SEC filings. Check original filings before making any investment decision.