Industrials › Industrial Instruments For Measurement, Display, And Control

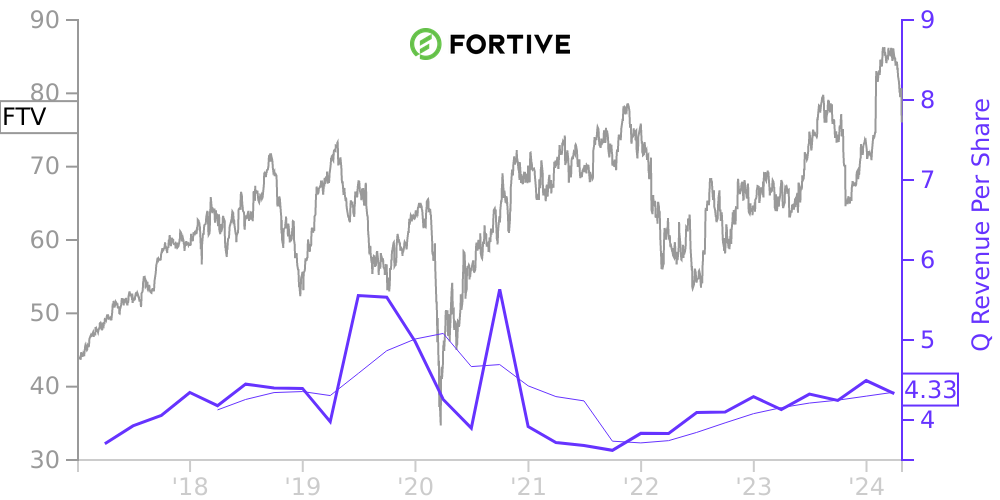
FTV Stock Price Correlated With Fortive Financials
External Links ⌄
Income Statement
Cash Flow
Balance Sheet
FTV Income Statement
Enable JavaScript and reload
Revenue, Net:
Cost of Goods & Services Sold:
Gross Profit:
Selling, General & Admin Expense:
Research & Development Expense:
Total Operating Expenses:
Operating Income:
Income Taxes:
Net Income:
FTV Cash Flow
Enable JavaScript and reload
Operating Activities Net Income:
Depreciation, Depletion & Amortization:
Change in Accounts Receiveable:
Net Cash from Operations:
Repurchases/Buybacks Common Stock:
Issuance of Long-term Debt:
Cash Dividends Paid:
Net Cash from Financing Activities:
Property, Plant & Equipment Purchases:
Purchases of Businesses, Net of Cash:
Net Cash from Investing Activities:
Net Change in Cash & Equivalents:
FTV Balance Sheet
Enable JavaScript and reload
Cash and Cash Equivalents:
Short-Term Investments:
Accounts Receivable, Net:
Inventories:
Total Current Assets:
Property, Plant & Equipment, Net:
Total Assets:
Accounts Payable:
Current Portion of Long-Term Debt:
Total Short-Term Liabilities:
Long Term Debt, Non-Current Portion:
Total Long-Term Liabilities:
Total Liabilities:
COMPANY PROFILE
NOTE 1. BUSINESS OVERVIEW AND BASIS FOR PRESENTATION
Fortive Corporation (“Fortive,” “the Company,” “we,” “our,” “us”) is a provider of essential technologies for connected workflow solutions across a range of attractive end-markets. Our strategic segments - Intelligent Operating Solutions, Precision Technologies, and Advanced Healthcare Solutions - include well-known brands with leading positions in their markets. Our businesses design, develop, manufacture, and service professional and engineered products, software, and services, building upon leading brand names, innovative technologies, and significant market positions. We are headquartered in Everett, Washington and employ a team of more than 18,000 research and development, manufacturing, sales, distribution, service, and administrative employees in more than 50 countries around the world.
Basis of Presentation
The accompanying consolidated financial statements present our historical financial position, results of operations, changes in equity and cash flows in accordance with accounting principles generally accepted in the United States of America (“GAAP”). Certain reclassifications have been made to prior year financial information to conform to the current period presentation. Unless otherwise indicated, all amounts in the notes to the consolidated financial statements refer to continuing operations.
The financial statements include our accounts and the accounts of our subsidiaries. All intercompany balances and transactions have been eliminated upon consolidation. The consolidated financial statements also reflect the impact of noncontrolling interests. Noncontrolling interests do not have a significant impact on our consolidated results of operations; therefore, net earnings and net earnings per share attributable to noncontrolling interests are not presented separately in our Consolidated Statements of Earnings. Net earnings attributable to noncontrolling interests have been reflected in Selling, general, and administrative expenses and were insignificant in all periods presented.
Vontier Separation and Discontinued Operations
On October 9, 2020, we completed the separation of Vontier Corporation (“Vontier”), the entity we created to hold our former Industrial Technologies segment (the “Separation”). The accounting requirements for reporting the Vontier business as a discontinued operation were met when the Separation was completed. Accordingly, the consolidated financial statements reflect the results of the Vontier business as a discontinued operation for all periods presented.
On January 19, 2021, we completed an exchange (the “Debt-for-Equity Exchange”) of 33.5 million shares of common stock of Vontier, representing all of the Retained Vontier Shares, for $1.1 billion in aggregate principal amount of indebtedness of the Company held by Goldman Sachs & Co., including (i) all $400 million of the term loan outstanding under the 364-Day Term Loan Credit Agreement, dated as of March 23, 2020 (“Term Loan due March 2021”) and (ii) $683.2 million of the $1.0 billion of term loan outstanding under the Term Loan Credit Agreement, dated as of March 1, 2019 (the “Term Loan Due May 2021”).
On October 1, 2018, we completed the split-off of businesses in our automation and specialty platform (the “A&S Business”). Accordingly, the A&S Business has been reported as discontinued operations in our consolidated financial statements for all periods presented.
Segment Presentation
We operate and report our results in three segments, Intelligent Operating Solutions, Precision Technologies, and Advanced Healthcare Solutions, each of which is further described below.
Our Intelligent Operating Solutions segment provides leading workflow solutions to accelerate industrial and facility reliability and performance, as well as compliance and safety across a range of vertical end markets, including manufacturing, process industries, healthcare, utilities and power, communications
Free historical financial statements for Fortive Corp. See how revenue, income, cash flow, and balance sheet financials have changed over 37 quarters since 2017. Compare with FTV stock chart to see long term trends.
Data imported from Fortive Corp SEC filings. Check original filings before making any investment decision.