Industrials › Transportation Services

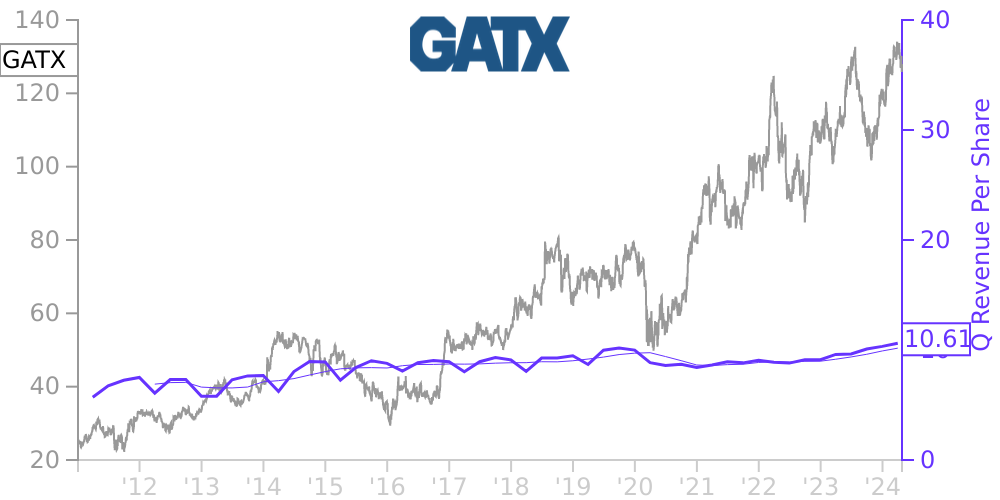
GATX Stock Price Correlated With GATX Financials
External Links ⌄
Income Statement
Cash Flow
Balance Sheet
GATX Income Statement
Enable JavaScript and reload
Revenue, Net:
Cost of Goods & Services Sold:
Gross Profit:
Selling, General & Admin Expense:
Research & Development Expense:
Total Operating Expenses:
Operating Income:
Income Taxes:
Net Income:
GATX Cash Flow
Enable JavaScript and reload
Operating Activities Net Income:
Depreciation, Depletion & Amortization:
Change in Accounts Receiveable:
Net Cash from Operations:
Repurchases/Buybacks Common Stock:
Issuance of Long-term Debt:
Cash Dividends Paid:
Net Cash from Financing Activities:
Property, Plant & Equipment Purchases:
Purchases of Businesses, Net of Cash:
Net Cash from Investing Activities:
Net Change in Cash & Equivalents:
GATX Balance Sheet
Enable JavaScript and reload
Cash and Cash Equivalents:
Short-Term Investments:
Accounts Receivable, Net:
Inventories:
Total Current Assets:
Property, Plant & Equipment, Net:
Total Assets:
Accounts Payable:
Current Portion of Long-Term Debt:
Total Short-Term Liabilities:
Long Term Debt, Non-Current Portion:
Total Long-Term Liabilities:
Total Liabilities:
COMPANY PROFILE
NOTE 2. Basis of Presentation
The accompanying unaudited consolidated financial statements of GATX Corporation and its
subsidiaries have been prepared in accordance with accounting principles generally accepted in the
United States of America for interim financial information and with the instructions to Form 10-Q
and Article 10 of Regulation S-X. Accordingly, they do not include all of the information and
footnotes required by these accounting principles for complete financial statements. In the
opinion of management, all adjustments (which are of a normal recurring nature) considered
necessary for a fair presentation have been included. Operating results for the three months ended
March 31, 2011, are not necessarily indicative of the results that may be achieved for the entire
year ending December 31, 2011. In particular, ASC’s fleet is generally inactive for a significant
portion of the first quarter of each year due to the winter conditions on the Great Lakes. In
addition, the timing of asset remarketing income is dependent, in part, on market conditions and,
therefore, does not occur evenly from period to period. For further information, refer to the
consolidated financial statements and footnotes for the year ended December 31, 2010, as set forth
in the Company’s Annual Report on Form 10-K as filed with the Securities and Exchange Commission
(“SEC”).
Accounting Adjustment
During the first quarter of 2010, the Company discovered a clerical error in the preparation
of its Consolidated Balance Sheet as of December 31, 2009, and Consolidated Statement of Cash Flows
for the quarter and year ended December 31, 2009. The error resulted in a $13.1 million
overstatement in each of cash and cash equivalents; accounts payable and accrued expenses; and net
cash provided by operating activities. Management has determined that the effect of this error is
immaterial and adjusted its Consolidated Balance Sheet and Consolidated Statement of Cash Flows in
2010 to correct this error.
Free historical financial statements for Gatx Corp. See how revenue, income, cash flow, and balance sheet financials have changed over 61 quarters since 2011. Compare with GATX stock chart to see long term trends.
Data imported from Gatx Corp SEC filings. Check original filings before making any investment decision.