Technology › Services-Computer Integrated Systems Design

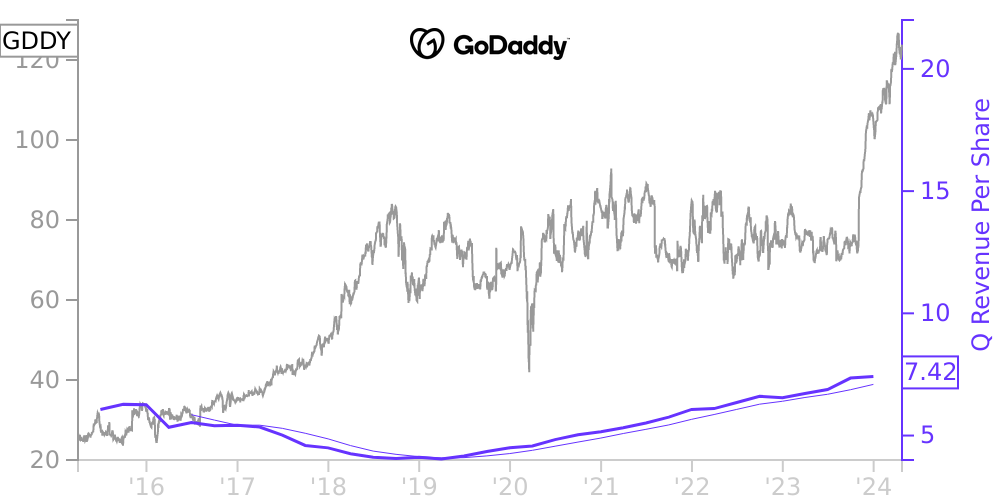
GDDY Stock Price Correlated With GoDaddy Financials
External Links ⌄
Income Statement
Cash Flow
Balance Sheet
GDDY Income Statement
Enable JavaScript and reload
Revenue, Net:
Cost of Goods & Services Sold:
Gross Profit:
Selling, General & Admin Expense:
Research & Development Expense:
Total Operating Expenses:
Operating Income:
Income Taxes:
Net Income:
GDDY Cash Flow
Enable JavaScript and reload
Operating Activities Net Income:
Depreciation, Depletion & Amortization:
Change in Accounts Receiveable:
Net Cash from Operations:
Repurchases/Buybacks Common Stock:
Issuance of Long-term Debt:
Cash Dividends Paid:
Net Cash from Financing Activities:
Property, Plant & Equipment Purchases:
Purchases of Businesses, Net of Cash:
Net Cash from Investing Activities:
Net Change in Cash & Equivalents:
GDDY Balance Sheet
Enable JavaScript and reload
Cash and Cash Equivalents:
Short-Term Investments:
Accounts Receivable, Net:
Inventories:
Total Current Assets:
Property, Plant & Equipment, Net:
Total Assets:
Accounts Payable:
Current Portion of Long-Term Debt:
Total Short-Term Liabilities:
Long Term Debt, Non-Current Portion:
Total Long-Term Liabilities:
Total Liabilities:
COMPANY PROFILE
Organization and Background Description of Business
We deliver simple, easy-to-use cloud-based products, outcome-driven, personalized guidance and ease and access to payment systems. Our products enable our customers to establish a digital presence, connect with their customers and manage their presence.
Organization
We are the sole managing member of Desert Newco, LLC and its subsidiaries (Desert Newco), and as a result, we consolidate its financial results and report non-controlling interests representing the economic interests held by other members. The calculation of non-controlling interests excludes any net income attributable directly to GoDaddy Inc. We owned more than 99.8% of Desert Newco's limited liability company units (LLC Units) as of December 31, 2021.
Basis of Presentation
Our financial statements have been prepared in accordance with generally accepted accounting principles in the United States (GAAP), and include our accounts and the accounts of our subsidiaries. All material intercompany accounts and transactions have been eliminated.
Prior Period Reclassifications
Reclassifications of certain immaterial prior period amounts have been made to conform to the current period presentation.
Use of Estimates
GAAP requires us to make estimates and assumptions affecting amounts reported in our financial statements. Our more significant estimates include:
• the relative stand-alone selling price (SSP) of the indicated performance obligations included in revenue arrangements with multiple performance obligations;
• the estimated reserve for refunds;
• the fair value of assets acquired and liabilities assumed in business acquisitions;
• the assessment of recoverability of long-lived assets;
• the estimated useful lives of intangible and depreciable assets;
• the fair value of financial instruments;
• the recognition, measurement and valuation of current and deferred income taxes; and
• the recognition and measurement of loss contingencies, indirect tax liabilities and certain accrued liabilities.
We periodically evaluate our estimates and adjust prospectively, if necessary. We believe our estimates and assumptions are reasonable; however, actual results may differ.
Segment
As of December 31, 2021, our chief operating decision maker was our Chief Executive Officer who reviews financial information presented on a consolidated basis for purposes of allocating resources and evaluating financial performance for the entire company. Accordingly, we have a single operating and reportable segment.
Free historical financial statements for GoDaddy Inc. See how revenue, income, cash flow, and balance sheet financials have changed over 44 quarters since 2015. Compare with GDDY stock chart to see long term trends.
Data imported from GoDaddy Inc SEC filings. Check original filings before making any investment decision.