Industrials › Electronic And Other Electrical Equipment (No Computer Equip)

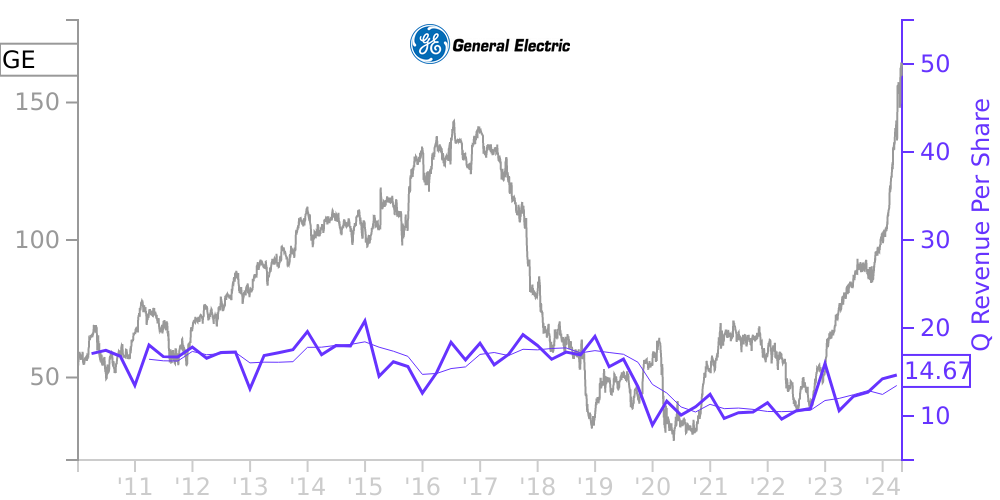
GE Stock Price Correlated With General Electric Co Financials
External Links ⌄
Income Statement
Cash Flow
Balance Sheet
GE Income Statement
Enable JavaScript and reload
Revenue, Net:
Cost of Goods & Services Sold:
Gross Profit:
Selling, General & Admin Expense:
Research & Development Expense:
Total Operating Expenses:
Operating Income:
Income Taxes:
Net Income:
GE Cash Flow
Enable JavaScript and reload
Operating Activities Net Income:
Depreciation, Depletion & Amortization:
Change in Accounts Receiveable:
Net Cash from Operations:
Repurchases/Buybacks Common Stock:
Issuance of Long-term Debt:
Cash Dividends Paid:
Net Cash from Financing Activities:
Property, Plant & Equipment Purchases:
Purchases of Businesses, Net of Cash:
Net Cash from Investing Activities:
Net Change in Cash & Equivalents:
GE Balance Sheet
Enable JavaScript and reload
Cash and Cash Equivalents:
Short-Term Investments:
Accounts Receivable, Net:
Inventories:
Total Current Assets:
Property, Plant & Equipment, Net:
Total Assets:
Accounts Payable:
Current Portion of Long-Term Debt:
Total Short-Term Liabilities:
Long Term Debt, Non-Current Portion:
Total Long-Term Liabilities:
Total Liabilities:
COMPANY PROFILE
Financial Statement Presentation We have reclassified certain prior-year amounts to conform to the current-year's presentation. Financial data and related measurements are presented in the following categories: GE – This represents the adding together of all affiliates other than General Electric Capital Services, Inc. (GECS), whose operations are presented on a one-line basis. GECS – This affiliate owns all of the common stock of General Electric Capital Corporation (GECC). GECC and its respective affiliates are consolidated in the accompanying GECS columns and constitute the majority of its business. Consolidated – This represents the adding together of GE and GECS, giving effect to the elimination of transactions between GE and GECS. Operating Segments – These comprise our six businesses, focused on the broad markets they serve: Energy Infrastructure, Aviation, Healthcare, Transportation, Home & Business Solutions and GE Capital. Prior-period information has been reclassified to be consistent with how we manage d our businesses in 2011 . Unless otherwise indicated, information in these notes to consolidated financial statements relates to continuing operations. Certain of our operations have been presented as discontinued. See Note 2. On February 22 , 2012, we merged our wholly-owned subsidiary, GECS, with and into GECS' wholly-owned subsidiary, GECC. The merger simplifie d our financial services' corporate structure by consolidating financial services entities and assets within our organization and simplifying Securities and Exchange Commission and regulatory reporting. Upon the merger, GECC became the surviving corporation and assumed all of GECS' rights and obligations and became wholly-owned directly by General Electric. Our financial services segment, GE Capital, will continue to comprise the continuing operations of GECC, which now includes the run-off insurance operations previously held and managed in GECS. References to GECS, GECC and the GE Capital segment in this Form 10-K Report relate to the entities or segment as they existed during 2011 and do not reflect the February 22 , 2012 merger. The effects of translating to U.S. dollars the financial statements of non-U.S. affiliates whose functional currency is the local currency are included in shareowners' equity. Asset and liability accounts are translated at year-end exchange rates, while revenues and expenses are translated at average rates for the respective periods. Preparing financial statements in conformity with U.S. GAAP requires us to make estimates based on assumptions about current, and for some estimates future, economic and market conditions (for example, unemployment, market liquidity, the real estate market, etc.), which affect reported amounts and related disclosures in our financial statements. Although our current estimates contemplate current conditions and how we expect them to change in the future, as appropriate, it is reasonably possible that in 2012 actual conditions could be worse than anticipated in those estimates, which could materially affect our results of operations and financial position. Among other effects, such changes could result in future impairments of investment securities, goodwill, intangibles and long-lived assets, incremental losses on financing receivables, establishment of valuation allowances on deferred tax assets and increased tax liabilities.
Free historical financial statements for General Electric Co.. See how revenue, income, cash flow, and balance sheet financials have changed over 66 quarters since 2010. Compare with GE stock chart to see long term trends.
Data imported from General Electric Co. SEC filings. Check original filings before making any investment decision.