Industrials › Pumps And Pumping Equipment

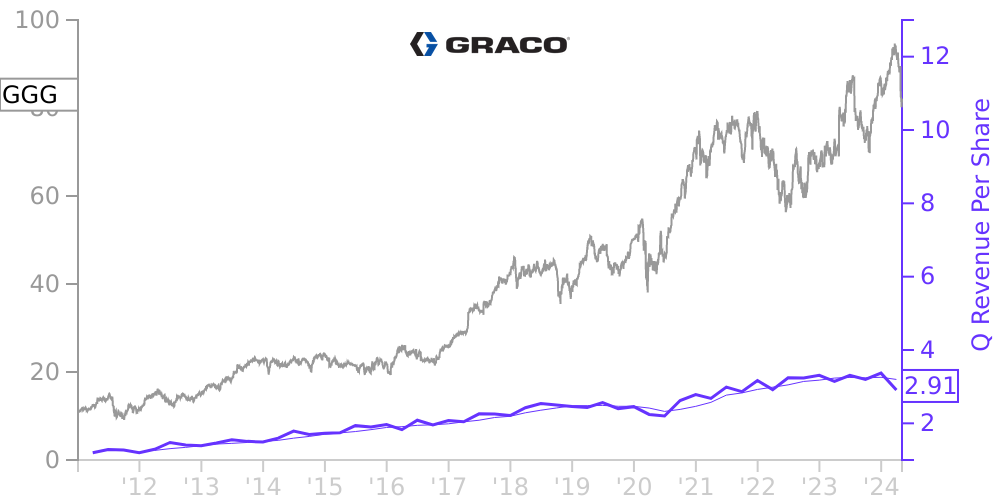
GGG Stock Price Correlated With Graco Financials
External Links ⌄
Income Statement
Cash Flow
Balance Sheet
GGG Income Statement
Enable JavaScript and reload
Revenue, Net:
Cost of Goods & Services Sold:
Gross Profit:
Selling, General & Admin Expense:
Research & Development Expense:
Total Operating Expenses:
Operating Income:
Income Taxes:
Net Income:
GGG Cash Flow
Enable JavaScript and reload
Operating Activities Net Income:
Depreciation, Depletion & Amortization:
Change in Accounts Receiveable:
Net Cash from Operations:
Repurchases/Buybacks Common Stock:
Issuance of Long-term Debt:
Cash Dividends Paid:
Net Cash from Financing Activities:
Property, Plant & Equipment Purchases:
Purchases of Businesses, Net of Cash:
Net Cash from Investing Activities:
Net Change in Cash & Equivalents:
GGG Balance Sheet
Enable JavaScript and reload
Cash and Cash Equivalents:
Short-Term Investments:
Accounts Receivable, Net:
Inventories:
Total Current Assets:
Property, Plant & Equipment, Net:
Total Assets:
Accounts Payable:
Current Portion of Long-Term Debt:
Total Short-Term Liabilities:
Long Term Debt, Non-Current Portion:
Total Long-Term Liabilities:
Total Liabilities:
COMPANY PROFILE
Basis of Presentation The consolidated balance sheet of Graco Inc. and subsidiaries (the “Company”) as of July 1, 2022 and the related statements of earnings, comprehensive income and shareholders' equity for the three and six months ended July 1, 2022 and June 25, 2021, and cash flows for the six months ended July 1, 2022 and June 25, 2021 have been prepared by the Company and have not been audited.
In the opinion of management, these consolidated financial statements reflect all adjustments (consisting of only normal recurring adjustments) necessary to present fairly the financial position of the Company as of July 1, 2022, and the results of operations and cash flows for all periods presented.
Certain information and footnote disclosures normally included in financial statements prepared in accordance with generally accepted accounting principles have been condensed or omitted. Therefore, these statements should be read in conjunction with the financial statements and notes thereto included in the Company’s 2021 Annual Report on Form 10-K.
The results of operations for interim periods are not necessarily indicative of results that will be realized for the full fiscal year.
Free historical financial statements for Graco Inc. See how revenue, income, cash flow, and balance sheet financials have changed over 62 quarters since 2011. Compare with GGG stock chart to see long term trends.
Data imported from Graco Inc SEC filings. Check original filings before making any investment decision.