Consumer Discretionary › Retail-Computer And Computer Software Stores

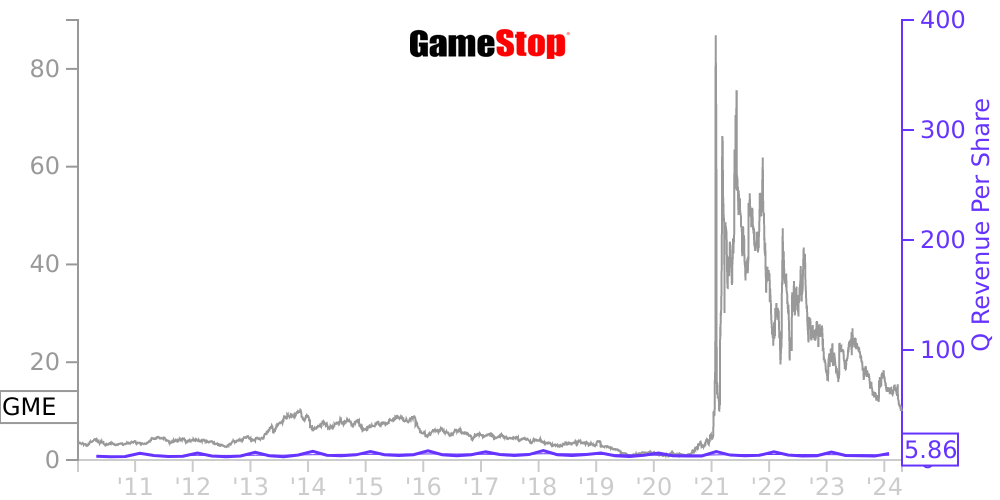
GME Stock Price Correlated With GameStop Financials
External Links ⌄
Income Statement
Cash Flow
Balance Sheet
GME Income Statement
Enable JavaScript and reload
Revenue, Net:
Cost of Goods & Services Sold:
Gross Profit:
Selling, General & Admin Expense:
Research & Development Expense:
Total Operating Expenses:
Operating Income:
Income Taxes:
Net Income:
GME Cash Flow
Enable JavaScript and reload
Operating Activities Net Income:
Depreciation, Depletion & Amortization:
Change in Accounts Receiveable:
Net Cash from Operations:
Repurchases/Buybacks Common Stock:
Issuance of Long-term Debt:
Cash Dividends Paid:
Net Cash from Financing Activities:
Property, Plant & Equipment Purchases:
Purchases of Businesses, Net of Cash:
Net Cash from Investing Activities:
Net Change in Cash & Equivalents:
GME Balance Sheet
Enable JavaScript and reload
Cash and Cash Equivalents:
Short-Term Investments:
Accounts Receivable, Net:
Inventories:
Total Current Assets:
Property, Plant & Equipment, Net:
Total Assets:
Accounts Payable:
Current Portion of Long-Term Debt:
Total Short-Term Liabilities:
Long Term Debt, Non-Current Portion:
Total Long-Term Liabilities:
Total Liabilities:
COMPANY PROFILE
General Information The Company
GameStop Corp. ("GameStop," "we," "us," "our," or the "Company"), a Delaware corporation established in 1996, is a leading specialty retailer offering games and entertainment products through its ecommerce properties and thousands of stores.
We operate our business in four geographic segments: United States, Canada, Australia and Europe. The information contained in these consolidated financial statements refers to continuing operations unless otherwise noted. See Note 6 , "Segment Information," for additional information.
Basis of Presentation and Consolidation
Our consolidated financial statements include our accounts and the accounts of our wholly owned subsidiaries. All intercompany accounts and transactions have been eliminated in consolidation. Our former Spring Mobile business is presented as discontinued operations in the statements of operations for periods presented. The Consolidated Statements of Cash flows is presented on a combined basis for all periods presented and, therefore, does not segregate cash flows from continuing and discontinued operations. The information contained in these notes to our consolidated financial statements refers to continuing operations unless otherwise noted.
Our fiscal year is composed of the 52 or 53 weeks ending on the Saturday closest to the last day of January. Fiscal year 2021 consisted of the 52 weeks ended on January 29, 2022 ("fiscal 2021"). Fiscal year 2020 consisted of the 52 weeks ended on January 30, 2021 ("fiscal 2020"). Fiscal year 2019 consisted of the 52 weeks ended on February 1, 2020 ("fiscal 2019").
Use of Estimates
The preparation of financial statements in conformity with accounting principles generally accepted in the United States of America (“GAAP”) requires us to make estimates and assumptions that affect the reported amounts of assets and liabilities, the disclosure of contingent assets and liabilities at the date of the financial statements and the reported amounts of revenues and expenses during the reporting period. In preparing these financial statements, we have made our best estimates and judgments of certain amounts included in the financial statements, giving due consideration to materiality. Changes in the estimates and assumptions used by us could have a significant impact on our financial results. Actual results could differ from those estimates.
Free historical financial statements for GameStop Corp.. See how revenue, income, cash flow, and balance sheet financials have changed over 65 quarters since 2010. Compare with GME stock chart to see long term trends.
Data imported from GameStop Corp. SEC filings. Check original filings before making any investment decision.