Industrials › Wholesale-Lumber And Other Construction Materials

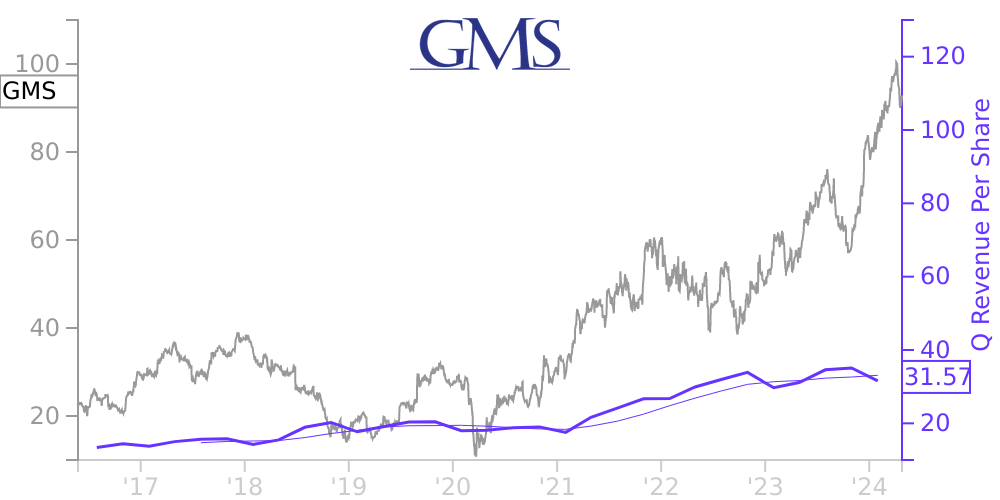
GMS Stock Price Correlated With GMS Financials
External Links ⌄
Income Statement
Cash Flow
Balance Sheet
GMS Income Statement
Enable JavaScript and reload
Revenue, Net:
Cost of Goods & Services Sold:
Gross Profit:
Selling, General & Admin Expense:
Research & Development Expense:
Total Operating Expenses:
Operating Income:
Income Taxes:
Net Income:
GMS Cash Flow
Enable JavaScript and reload
Operating Activities Net Income:
Depreciation, Depletion & Amortization:
Change in Accounts Receiveable:
Net Cash from Operations:
Repurchases/Buybacks Common Stock:
Issuance of Long-term Debt:
Cash Dividends Paid:
Net Cash from Financing Activities:
Property, Plant & Equipment Purchases:
Purchases of Businesses, Net of Cash:
Net Cash from Investing Activities:
Net Change in Cash & Equivalents:
GMS Balance Sheet
Enable JavaScript and reload
Cash and Cash Equivalents:
Short-Term Investments:
Accounts Receivable, Net:
Inventories:
Total Current Assets:
Property, Plant & Equipment, Net:
Total Assets:
Accounts Payable:
Current Portion of Long-Term Debt:
Total Short-Term Liabilities:
Long Term Debt, Non-Current Portion:
Total Long-Term Liabilities:
Total Liabilities:
COMPANY PROFILE
Business, Basis of Presentation and Summary of Significant Accounting Policies Business
Founded in 1971, GMS Inc. (“we,” “our,” “us,” or the “Company”), through its wholly-owned operating subsidiaries, is a distributor of specialty building products including wallboard, suspended ceilings systems, or ceilings, steel framing and other complementary building products. We purchase products from many manufacturers and then distribute these goods to a customer base consisting of wallboard and ceilings contractors and homebuilders and, to a lesser extent, general contractors and individuals. We operate a network of 268 distribution centers across the United States and Canada.
Principles of Consolidation
The consolidated financial statements present the results of operations, financial position, stockholders’ equity and cash flows of the Company and its subsidiaries. All material intercompany balances and transactions have been eliminated in consolidation. The results of operations of businesses acquired are included from their respective dates of acquisition.
Use of Estimates
The preparation of financial statements in conformity with U.S. generally accepted accounting principles (“GAAP”) requires management to make estimates and assumptions that affect the reported amounts of assets and liabilities and disclosure of contingent assets and liabilities at the date of the financial statements and the reported amounts of revenues and expenses during the reporting period. Actual results could differ from those estimates.
Foreign Currency Translation
Assets and liabilities of the Company’s Canadian subsidiaries are translated at the exchange rate prevailing at the balance sheet date, while income and expenses are translated at average rates for the period. Translation gains and losses are reported as a separate component of stockholders’ equity and other comprehensive income (loss). Gains and losses on foreign currency transactions are recognized in the Consolidated Statements of Operations and Comprehensive Income (Loss) within other income, net.
Reclassifications
Certain amounts in the prior year financial statements have been reclassified to conform to the current year presentation. The Company reclassified $11.5 million of a derivative liability from other liabilities to other accrued expenses and current liabilities in the Consolidated Balance Sheet as of April 30, 2020 to correct an immaterial misclassification.
Cash and Cash Equivalents
The Company considers all highly liquid investments with a maturity of three months or less when purchased to be cash equivalents.
Trade Accounts Receivable
The Company records accounts and notes receivable net of allowances, including an allowance for expected credit losses. The Company maintains an allowance for estimated losses due to the failure of customers to make required payments, as well as allowances for cash discounts. The Company’s estimate of the allowance for expected credit losses is based on an assessment of individual past due accounts, historical loss information, accounts receivable aging and current economic factors and the Company’s expectation of future economic conditions. Account balances are written off when the potential for recovery is considered remote. Other receivables primarily include vendor rebate receivables.Other allowances includes reserves for cash discounts and reserves for service charges.
The Company routinely assesses the financial strength of its customers and generally does not require collateral. Concentrations of credit risk with respect to trade accounts receivable are limited due to the large number of geographically diverse customers comprising the Company’s customer base.
Inventories
Inventories consist of finished goods purchased for resale and include wallboard, ceilings, steel framing and other specialty building products. Inventories are valued at the lower of cost or market (net realizable value). The cost of inventories is determi
Free historical financial statements for GMS Inc.. See how revenue, income, cash flow, and balance sheet financials have changed over 37 quarters since 2016. Compare with GMS stock chart to see long term trends.
Data imported from GMS Inc. SEC filings. Check original filings before making any investment decision.