
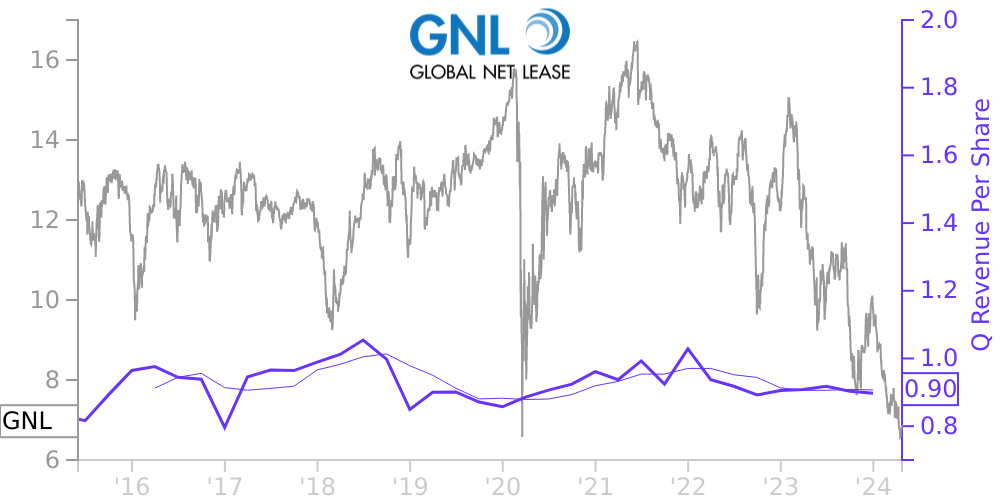
GNL Stock Price Correlated With Global Net Lease Financials
External Links ⌄
Income Statement
Cash Flow
Balance Sheet
GNL Income Statement
Enable JavaScript and reload
Revenue, Net:
Cost of Goods & Services Sold:
Gross Profit:
Selling, General & Admin Expense:
Research & Development Expense:
Total Operating Expenses:
Operating Income:
Income Taxes:
Net Income:
GNL Cash Flow
Enable JavaScript and reload
Operating Activities Net Income:
Depreciation, Depletion & Amortization:
Change in Accounts Receiveable:
Net Cash from Operations:
Repurchases/Buybacks Common Stock:
Issuance of Long-term Debt:
Cash Dividends Paid:
Net Cash from Financing Activities:
Property, Plant & Equipment Purchases:
Purchases of Businesses, Net of Cash:
Net Cash from Investing Activities:
Net Change in Cash & Equivalents:
GNL Balance Sheet
Enable JavaScript and reload
Cash and Cash Equivalents:
Short-Term Investments:
Accounts Receivable, Net:
Inventories:
Total Current Assets:
Property, Plant & Equipment, Net:
Total Assets:
Accounts Payable:
Current Portion of Long-Term Debt:
Total Short-Term Liabilities:
Long Term Debt, Non-Current Portion:
Total Long-Term Liabilities:
Total Liabilities:
COMPANY PROFILE
Organization Global Net Lease, Inc. (the “Company”) is an externally managed real estate investment trust for United States (“U.S.”) federal income tax purposes (“REIT”) that focuses on acquiring and managing a globally diversified portfolio of strategically-located commercial real estate properties, which consist primarily of “Investment Grade” (defined below). The Company invests in commercial properties, with an emphasis on sale-leaseback transactions and mission-critical, single tenant net-lease assets.
As of December 31, 2021, the Company owned 309 properties (all references to number of properties, square footage and industry types are unaudited) consisting of 39.3 million rentable square feet, which were 99.0% leased, with a weighted-average remaining lease term of 8.3 years. Based on the percentage of annualized rental income on a straight-line basis as of December 31, 2021, approximately 60% of the Company’s properties were located in the U.S. and Canada and approximately 40% were located in Europe. In addition, the Company’s portfolio was comprised of 54% industrial/distribution properties, 42% office properties and 4% retail properties. These percentages are calculated using annualized straight-line rent converted from local currency into the U.S. Dollar (“USD”) as of December 31, 2021. The straight-line rent includes amounts for tenant concessions.
Substantially all of the Company’s business is conducted through the Global Net Lease Operating Partnership, L.P. (the “OP”), a Delaware limited partnership. The Company has retained Global Net Lease Advisors, LLC (the “Advisor”) to manage the Company’s affairs on a day-to-day basis. The Company’s properties are managed and leased to third parties by Global Net Lease Properties, LLC (the “Property Manager”). The Advisor and the Property Manager are under common control with AR Global Investments, LLC (“AR Global”), and these related parties receive compensation and fees for various services provided to the Company.
“Investment Grade” includes both actual investment grade ratings of the tenant or guarantor, if available, or implied investment grade. Implied investment grade may include actual ratings of the tenant parent, guarantor parent (regardless of whether or not the parent has guaranteed the tenant’s obligation under the lease) or tenants that are identified as investment grade by using a proprietary Moody’s analytical tool, which generates an implied rating by measuring an entity’s probability of default.
Free historical financial statements for Global Net Lease Inc. See how revenue, income, cash flow, and balance sheet financials have changed over 49 quarters since 2014. Compare with GNL stock chart to see long term trends.
Data imported from Global Net Lease Inc SEC filings. Check original filings before making any investment decision.