Industrials › Heavy Construction Other Than Building Const - Contractors

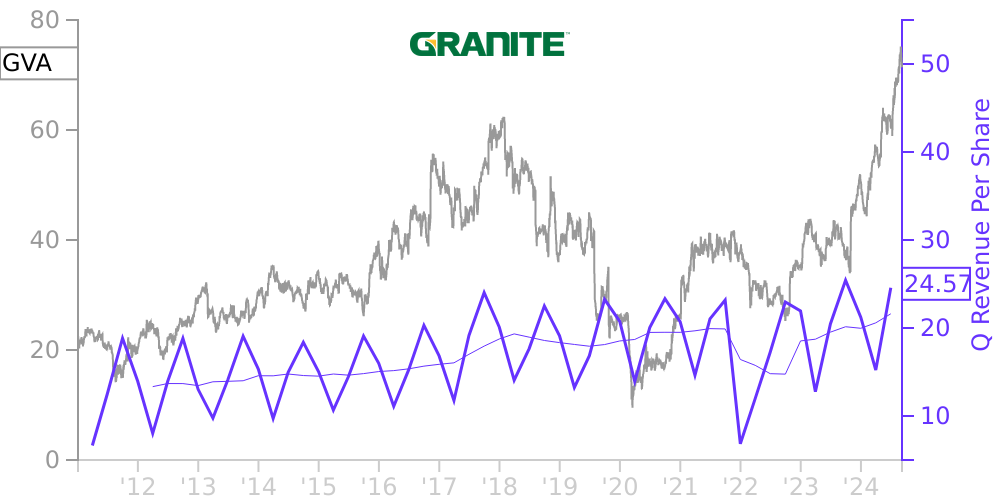
GVA Stock Price Correlated With Granite Construction Financials
External Links ⌄
Income Statement
Cash Flow
Balance Sheet
GVA Income Statement
Enable JavaScript and reload
Revenue, Net:
Cost of Goods & Services Sold:
Gross Profit:
Selling, General & Admin Expense:
Research & Development Expense:
Total Operating Expenses:
Operating Income:
Income Taxes:
Net Income:
GVA Cash Flow
Enable JavaScript and reload
Operating Activities Net Income:
Depreciation, Depletion & Amortization:
Change in Accounts Receiveable:
Net Cash from Operations:
Repurchases/Buybacks Common Stock:
Issuance of Long-term Debt:
Cash Dividends Paid:
Net Cash from Financing Activities:
Property, Plant & Equipment Purchases:
Purchases of Businesses, Net of Cash:
Net Cash from Investing Activities:
Net Change in Cash & Equivalents:
GVA Balance Sheet
Enable JavaScript and reload
Cash and Cash Equivalents:
Short-Term Investments:
Accounts Receivable, Net:
Inventories:
Total Current Assets:
Property, Plant & Equipment, Net:
Total Assets:
Accounts Payable:
Current Portion of Long-Term Debt:
Total Short-Term Liabilities:
Long Term Debt, Non-Current Portion:
Total Long-Term Liabilities:
Total Liabilities:
COMPANY PROFILE
1. Summary of Significant Accounting Policies
Description of Business : Granite Construction Incorporated is one of the largest diversified infrastructure companies in the United States, engaged in infrastructure projects including the construction of streets, roads, highways, mass transit facilities, airport infrastructure, bridges, dams, power-related facilities, utilities, tunnels and other infrastructure-related projects, site preparation, mining services, and infrastructure services for residential development, energy development, commercial and industrial sites, and other facilities, as well as construction management professional services. Our continuing operations have offices located in Alaska, Arizona, California, Colorado, Florida, Guam, Illinois, Nevada, Texas, Utah and Washington. Unless otherwise indicated, the terms “we,” “us,” “our,” “Company” and “Granite” refer to Granite Construction Incorporated and its wholly-owned and consolidated subsidiaries.
During the fourth quarter of 2021, the Company updated its strategy to focus on its core business capabilities, to leverage its current geographic based home markets in the civil construction and materials business and to target expansion based upon that combined strategy. Through our strategic analysis, it was determined that the end markets and geographic structure of the former Water and Mineral Services operating group (“WMS”) did not align with the Company’s new strategy and the Board of Directors approved a plan to sell these businesses within the next twelve months. As a result of these actions, we classified WMS as held-for-sale in the consolidated balance sheets and as discontinued operations in the consolidated statements of operations as of and for the year ended December 31, 2021 and applied these changes retrospectively for all other periods presented. See Note 2 for WMS financial information, which has been excluded from all other disclosures unless explicitly stated otherwise.
Also related to our new strategic plan, during the fourth quarter of 2021, we reorganized our operating groups to improve operating efficiencies and better position the Company for long-term growth. In alphabetical order, our continuing business operating groups are defined as follows:
• California;
• Central (formerly Heavy Civil, Federal and Midwest operating groups), which primarily includes offices in Arizona (formerly in the Northwest operating group), Colorado, Florida, Illinois, Texas and Guam; and
• Mountain (formerly Northwest), which primarily includes offices in Alaska, Nevada, Utah and Washington.
In addition, we revised the financial information our chief operating decision maker, or decision-making group (our “CODM”), regularly reviews to allocate resources and assess our performance. This change is consistent with our new strategic plan and better aligns with our continuing civil construction and materials business. Our CODM now regularly reviews financial information regarding our two primary product lines, construction and materials as well as our operating groups. We identified our CODM as our Chief Executive Officer and our Chief Operating Officer.
As a result of these changes, in accordance with Financial Accounting Standards Board (“FASB”) ASC Topic 280, Segment Reporting, our reportable segments, which are the same as our operating segments, were changed to: Construction and Materials. The Construction segment replaces the previous Transportation, Water and Specialty reportable segments, with the composition of our Materials segment for our continuing operations remaining unchanged. These changes have been applied retrospectively for all periods presented. See Note 21 for more information about our reportable segments.
Principles of Consolidation : The consolidated financial statements include the accounts of Granite Construction Incorporated and its wholly-owned and consolidated subsidiaries. All material inter-company transactions and accounts have been
Free historical financial statements for Granite Construction Inc. See how revenue, income, cash flow, and balance sheet financials have changed over 61 quarters since 2011. Compare with GVA stock chart to see long term trends.
Data imported from Granite Construction Inc SEC filings. Check original filings before making any investment decision.