
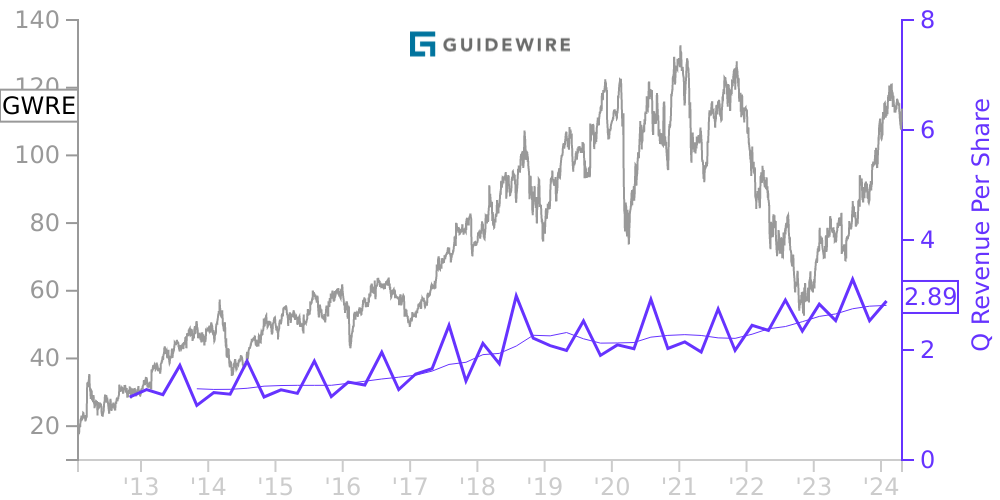
GWRE Stock Price Correlated With Guidewire Software Financials
External Links ⌄
Income Statement
Cash Flow
Balance Sheet
GWRE Income Statement
Enable JavaScript and reload
Revenue, Net:
Cost of Goods & Services Sold:
Gross Profit:
Selling, General & Admin Expense:
Research & Development Expense:
Total Operating Expenses:
Operating Income:
Income Taxes:
Net Income:
GWRE Cash Flow
Enable JavaScript and reload
Operating Activities Net Income:
Depreciation, Depletion & Amortization:
Change in Accounts Receiveable:
Net Cash from Operations:
Repurchases/Buybacks Common Stock:
Issuance of Long-term Debt:
Cash Dividends Paid:
Net Cash from Financing Activities:
Property, Plant & Equipment Purchases:
Purchases of Businesses, Net of Cash:
Net Cash from Investing Activities:
Net Change in Cash & Equivalents:
GWRE Balance Sheet
Enable JavaScript and reload
Cash and Cash Equivalents:
Short-Term Investments:
Accounts Receivable, Net:
Inventories:
Total Current Assets:
Property, Plant & Equipment, Net:
Total Assets:
Accounts Payable:
Current Portion of Long-Term Debt:
Total Short-Term Liabilities:
Long Term Debt, Non-Current Portion:
Total Long-Term Liabilities:
Total Liabilities:
COMPANY PROFILE
The Company and Summary of Significant Accounting Policies and Estimates Company
Guidewire Software, Inc., a Delaware corporation, was incorporated on September 20, 2001. Guidewire Software, Inc., together with its subsidiaries (the “Company”), provides a technology platform which combines core operations, digital engagement, analytics, and artificial intelligence (“AI”) applications. The Company’s technology platform supports core insurance operations, including underwriting and policy administration, claim management and billing; insights into data that can improve business decision making; and digital sales, service and claims experiences for policyholders, agents, and other key stakeholders. The Company’s customers are primarily property and casualty insurance carriers.
Basis of Presentation and Consolidation
The Company’s consolidated financial statements have been prepared in accordance with generally accepted accounting principles in the United States of America (“GAAP”). The consolidated financial statements and notes include the Company and its wholly-owned subsidiaries and reflect all adjustments (all of which are normal and recurring in nature) that, in the opinion of management, are necessary for a fair presentation of the periods presented. All intercompany balances and transactions have been eliminated in consolidation.
Reclassification
Beginning with the Annual Report on Form 10-K for fiscal year 2020, the Company changed the presentation in the consolidated statements of operations for revenue and cost of revenue to include subtotals for “subscription and support,” “license,” and “services.” The Company's previous presentation included subtotals for “license and subscription,” “maintenance” (now referred to as “support”), and “services”. Accordingly, fiscal year 2019 amounts have been reclassified to conform to the current period presentation in the Company's consolidated financial statements. Additionally, certain prior period amounts within operating activities in the consolidated statements of cash flows have been reclassified to conform to the current period presentation.
Use of Estimates
The preparation of the accompanying consolidated financial statements in conformity with GAAP requires management to make estimates and assumptions about future events that affect the amounts of assets and liabilities reported, disclosures about contingent assets and liabilities, and reported amounts of revenue and expenses. Significant items subject to such estimates include, but are not limited to, revenue recognition, the useful lives of property and equipment and intangible assets, accounts receivable allowances, valuation allowance for deferred tax assets, stock-based compensation, annual bonus attainment, income tax uncertainties, fair value of convertible senior notes and investments, valuation of goodwill and intangible assets, fair value of acquired assets and assumed liabilities, software development costs to be capitalized, leases, and contingencies. These estimates and assumptions are based on management’s best estimates and judgment. Management regularly evaluates its estimates and assumptions using historical experience and other factors; however, actual results could differ from these estimates.
Foreign Currency
The functional currency of the Company’s foreign subsidiaries is their respective local currency. The Company translates all assets and liabilities of foreign subsidiaries to U.S. dollars at the current exchange rate as of the applicable balance sheet date. Revenue and expenses are translated at the average exchange rate prevailing during the period in which the transactions occur. The effects of foreign currency translations are recorded in accumulated other comprehensive income (loss) as a separate component of stockholders’ equity in the accompanying consolidated balance sheets. Transaction gains and losses that arise from exchange rate fluctuations on transactions denominated in a curren
Free historical financial statements for Guidewire Software Inc. See how revenue, income, cash flow, and balance sheet financials have changed over 55 quarters since 2012. Compare with GWRE stock chart to see long term trends.
Data imported from Guidewire Software Inc SEC filings. Check original filings before making any investment decision.