Consumer Discretionary › Hotels And Motels

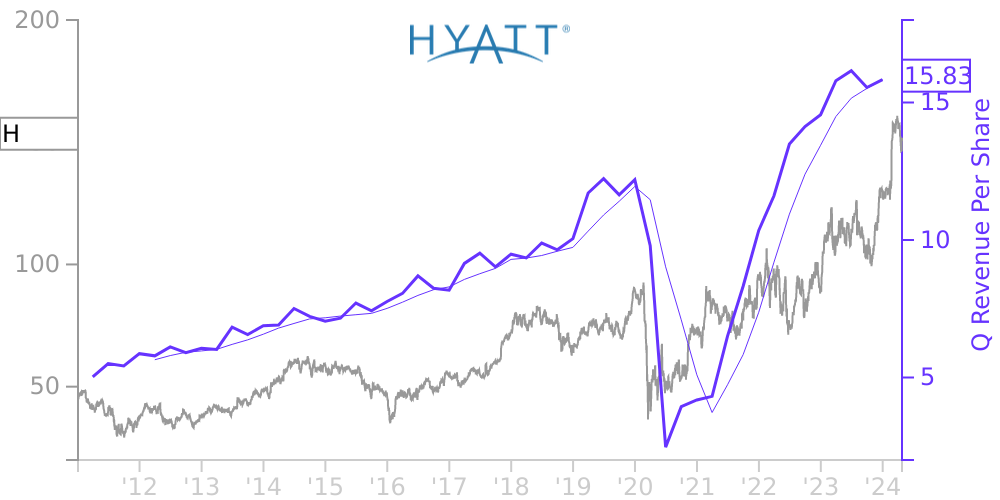
H Stock Price Correlated With Hyatt Hotels Financials
External Links ⌄
Income Statement
Cash Flow
Balance Sheet
H Income Statement
Enable JavaScript and reload
Revenue, Net:
Cost of Goods & Services Sold:
Gross Profit:
Selling, General & Admin Expense:
Research & Development Expense:
Total Operating Expenses:
Operating Income:
Income Taxes:
Net Income:
H Cash Flow
Enable JavaScript and reload
Operating Activities Net Income:
Depreciation, Depletion & Amortization:
Change in Accounts Receiveable:
Net Cash from Operations:
Repurchases/Buybacks Common Stock:
Issuance of Long-term Debt:
Cash Dividends Paid:
Net Cash from Financing Activities:
Property, Plant & Equipment Purchases:
Purchases of Businesses, Net of Cash:
Net Cash from Investing Activities:
Net Change in Cash & Equivalents:
H Balance Sheet
Enable JavaScript and reload
Cash and Cash Equivalents:
Short-Term Investments:
Accounts Receivable, Net:
Inventories:
Total Current Assets:
Property, Plant & Equipment, Net:
Total Assets:
Accounts Payable:
Current Portion of Long-Term Debt:
Total Short-Term Liabilities:
Long Term Debt, Non-Current Portion:
Total Long-Term Liabilities:
Total Liabilities:
COMPANY PROFILE
ORGANIZATIONHyatt Hotels Corporation, a Delaware corporation, and its consolidated subsidiaries (collectively "Hyatt Hotels Corporation") has offerings that consist of full services hotels, select service hotels, all-inclusive resorts, and other forms of residential, vacation ownership, and condominium units. We also offer travel distribution and destination management services through ALG Vacations and the Unlimited Vacation Club paid membership program offering member benefits exclusively at AMR Collection resorts within Latin America and the Caribbean. At December 31, 2021, (i) we operated or franchised 515 full service hotels, comprising 171,399 rooms throughout the world, (ii) we operated or franchised 539 select service hotels, comprising 78,067 rooms, of which 444 hotels are located in the United States, and (iii) we operated, franchised, or marketed 108 all-inclusive resorts, comprising 35,478 rooms. At December 31, 2021, our portfolio of properties operated in 70 countries around the world. Additionally, through strategic relationships, we provide certain reservation and/or loyalty program services to hotels that are unaffiliated with our hotel portfolio and operate under other tradenames or marks owned by such hotels or licensed by third parties.
Free historical financial statements for Hyatt Hotels Corp. See how revenue, income, cash flow, and balance sheet financials have changed over 61 quarters since 2011. Compare with H stock chart to see long term trends.
Data imported from Hyatt Hotels Corp SEC filings. Check original filings before making any investment decision.