Materials › Steel Works, Blast Furnaces And Rolling And Finishing Mills

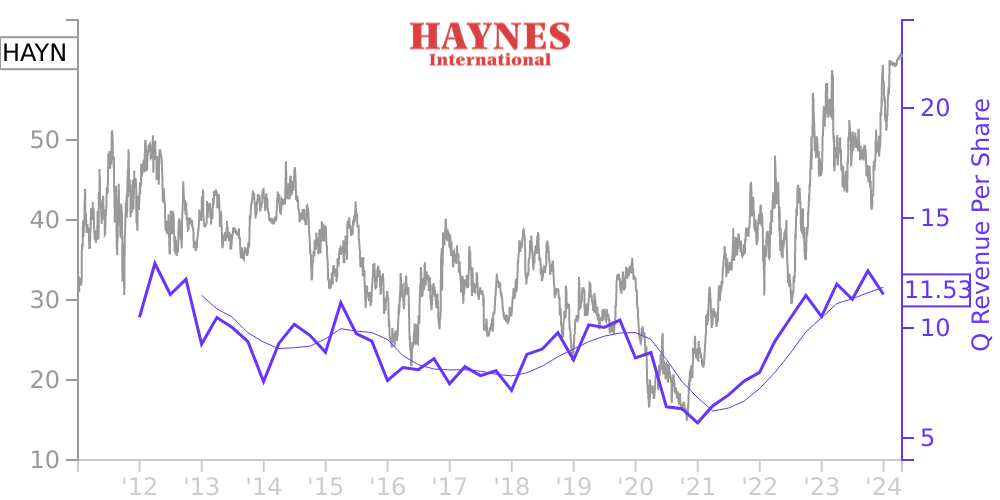
HAYN Stock Price Correlated With Haynes International Financials
External Links ⌄
Income Statement
Cash Flow
Balance Sheet
HAYN Income Statement
Enable JavaScript and reload
Revenue, Net:
Cost of Goods & Services Sold:
Gross Profit:
Selling, General & Admin Expense:
Research & Development Expense:
Total Operating Expenses:
Operating Income:
Income Taxes:
Net Income:
HAYN Cash Flow
Enable JavaScript and reload
Operating Activities Net Income:
Depreciation, Depletion & Amortization:
Change in Accounts Receiveable:
Net Cash from Operations:
Repurchases/Buybacks Common Stock:
Issuance of Long-term Debt:
Cash Dividends Paid:
Net Cash from Financing Activities:
Property, Plant & Equipment Purchases:
Purchases of Businesses, Net of Cash:
Net Cash from Investing Activities:
Net Change in Cash & Equivalents:
HAYN Balance Sheet
Enable JavaScript and reload
Cash and Cash Equivalents:
Short-Term Investments:
Accounts Receivable, Net:
Inventories:
Total Current Assets:
Property, Plant & Equipment, Net:
Total Assets:
Accounts Payable:
Current Portion of Long-Term Debt:
Total Short-Term Liabilities:
Long Term Debt, Non-Current Portion:
Total Long-Term Liabilities:
Total Liabilities:
COMPANY PROFILE
Note 2. Summary of Significant Accounting Policies A. Principles of Consolidation and Nature of Operations The consolidated financial statements include the accounts of Haynes International, Inc. and its wholly-owned subsidiaries. All intercompany transactions and balances are eliminated. The Company has manufacturing facilities in Kokomo, Indiana; Mountain Home, North Carolina; and Arcadia, Louisiana with service centers in LaPorte, Indiana; LaMirada, California; Houston, Texas; Windsor, Connecticut; Openshaw, England; Lenzburg, Switzerland; Shanghai, China; and sales offices in Paris, France; Singapore; Milan, Italy; and Tokyo, Japan. B. Cash and Cash Equivalents The Company considers all highly liquid investment instruments, including investments with original maturities of three months or less at acquisition, to be cash equivalents, the carrying value of which approximates fair value due to the short maturity of these investments. C. Accounts Receivable The Company maintains allowances for doubtful accounts for estimated losses resulting from the inability of its customers to make required payments. The Company markets its products to a diverse customer base, both in the United States of America and overseas. Trade credit is extended based upon evaluation of each customer’s ability to perform its obligation, which is updated periodically. D. Revenue Recognition The Company recognizes revenue when performance obligations under the terms of customer contracts are satisfied which occurs when control of the goods has been transferred to the customer and services have been performed. Allowances for sales returns are recorded as a component of net sales in the periods in which the related sales are recognized. The Company determines this allowance based on historical experience. Additionally, the Company recognizes revenue attributable to an up-front fee received from Titanium Metals Corporation (TIMET) as a result of a twenty-year agreement entered into on November 17, 2006 to provide conversion services to TIMET. See Note 16, Deferred Revenue for a description of accounting treatment relating to this up-front fee. E. Inventories Inventories are stated at the lower of cost or net realizable value. The cost of inventories is determined using the first-in, first-out (FIFO) method. The Company writes down its inventory for estimated obsolescence or unmarketable inventory in an amount equal to the difference between the cost of inventory and the estimated market or scrap value, if applicable, based upon assumptions about future demand and market conditions. F. Goodwill and Other Intangible Assets The Company has goodwill, trademarks, customer relationships and other intangibles as of September 30, 2021. As the customer relationships have a definite life, they are amortized over fifteen years. The Company reviews customer relationships for impairment whenever events or circumstances indicate that the carrying amount of an asset may not be recoverable. Recoverability of the assets is measured by a comparison of the carrying amount of the asset to the undiscounted future cash flows expected to be generated by the asset. If the carrying amount of an asset exceeds its estimated future cash flows, an impairment charge is recognized in the amount by which the carrying amount exceeds the fair value of the asset. Goodwill and trademarks (indefinite lived) are tested for impairment at least annually as of January 31 for goodwill and August 31 for trademarks (the annual impairment testing dates), or more frequently if impairment indicators exist. If the carrying value of the trademarks exceeds the fair value (determined using an income approach, based upon a discounted cash flow of an assumed royalty rate), impairment of the trademark may exist resulting in a charge to earnings to the extent of the impairment. The impairment test for goodwill is performed by comparing the fair value of a reporting unit with its carrying amount and recognizi
Free historical financial statements for Haynes International Inc. See how revenue, income, cash flow, and balance sheet financials have changed over 51 quarters since 2011. Compare with HAYN stock chart to see long term trends.
Data imported from Haynes International Inc SEC filings. Check original filings before making any investment decision.