Industrials › Services-Nursing And Personal Care Facilities

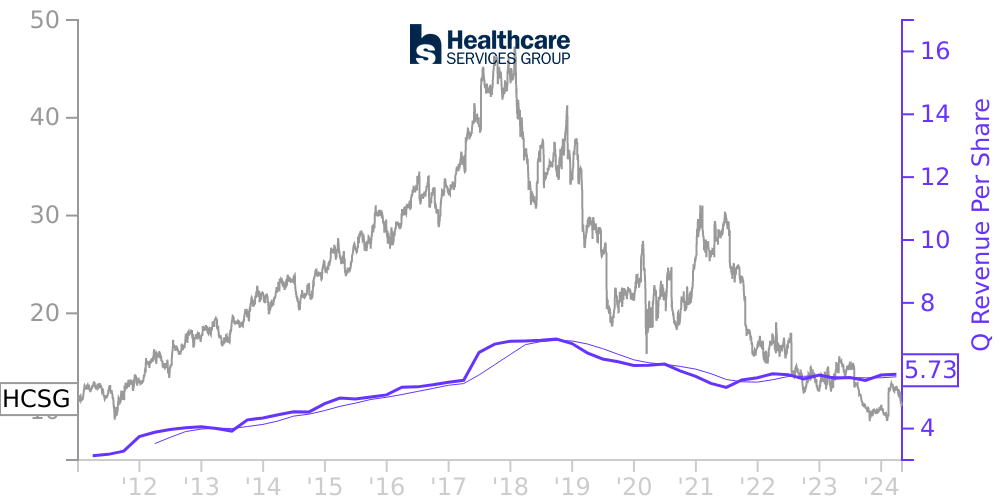
HCSG Stock Price Correlated With Healthcare Services Financials
External Links ⌄
Income Statement
Cash Flow
Balance Sheet
HCSG Income Statement
Enable JavaScript and reload
Revenue, Net:
Cost of Goods & Services Sold:
Gross Profit:
Selling, General & Admin Expense:
Research & Development Expense:
Total Operating Expenses:
Operating Income:
Income Taxes:
Net Income:
HCSG Cash Flow
Enable JavaScript and reload
Operating Activities Net Income:
Depreciation, Depletion & Amortization:
Change in Accounts Receiveable:
Net Cash from Operations:
Repurchases/Buybacks Common Stock:
Issuance of Long-term Debt:
Cash Dividends Paid:
Net Cash from Financing Activities:
Property, Plant & Equipment Purchases:
Purchases of Businesses, Net of Cash:
Net Cash from Investing Activities:
Net Change in Cash & Equivalents:
HCSG Balance Sheet
Enable JavaScript and reload
Cash and Cash Equivalents:
Short-Term Investments:
Accounts Receivable, Net:
Inventories:
Total Current Assets:
Property, Plant & Equipment, Net:
Total Assets:
Accounts Payable:
Current Portion of Long-Term Debt:
Total Short-Term Liabilities:
Long Term Debt, Non-Current Portion:
Total Long-Term Liabilities:
Total Liabilities:
COMPANY PROFILE
Note 1 — Basis of Reporting
The accompanying financial statements are unaudited and do not include certain information and
note disclosures required by accounting principles generally accepted in the United States for
complete financial statements. However, in our opinion, all adjustments (consisting of normal
recurring adjustments) considered necessary for a fair presentation have been included. The balance
sheet shown in this report as of December 31, 2010 has been derived from, and does not include, all
the disclosures contained in the financial statements for the year ended December 31, 2010. The
financial statements should be read in conjunction with the financial statements and notes thereto
included in our Annual Report on Form 10-K for the year ended December 31, 2010. The results of
operations for the three month period ended March 31, 2011 are not necessarily indicative of the
results that may be expected for the full fiscal year.
As of March 31, 2011, we operate one wholly-owned subsidiary, Huntingdon Holdings, Inc.
(“Huntingdon”). Huntingdon invests our cash and cash equivalents, and manages our portfolio of
marketable securities.
In preparing financial statements in conformity with accounting principles generally accepted
in the United States of America (“U.S. GAAP”), we make estimates and assumptions that affect the
reported amounts of assets and liabilities and disclosures of contingent assets and liabilities at
the date of the financial statements, as well as the reported amounts of revenues and expenses
during the reporting period. Actual results could differ from those estimates. Significant
estimates are used for, but not limited to, our allowance for doubtful accounts, accrued insurance
claims, asset valuations and review for potential impairment, share-based compensation, and
deferred income taxes. The estimates are based upon various factors including current and
historical trends, as well as other pertinent industry and regulatory authority information. We
regularly evaluate this information to determine if it is necessary to update the basis for our
estimates and to compensate for known changes.
Inventories and supplies include housekeeping and, linen and laundry supplies, as well as
dietary provisions and supplies. Inventories and supplies are stated at cost to approximate a
first-in, first-out (FIFO) basis. Linen supplies are amortized over a 24 month period.
Revenues are recorded net of sales taxes.
Free historical financial statements for Healthcare Services Inc. See how revenue, income, cash flow, and balance sheet financials have changed over 62 quarters since 2011. Compare with HCSG stock chart to see long term trends.
Data imported from Healthcare Services Inc SEC filings. Check original filings before making any investment decision.