Industrials › Aircraft Engines And Engine Parts

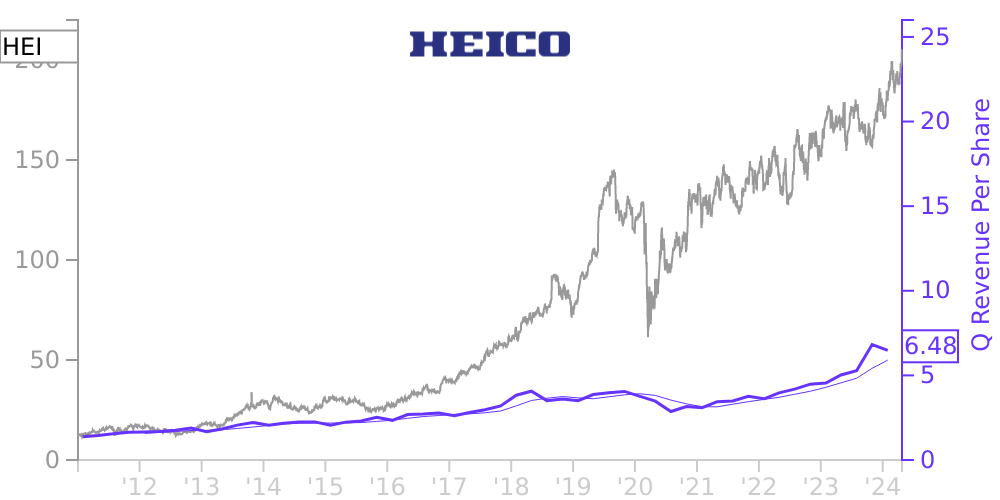
HEI Stock Price Correlated With HEICO Financials
External Links ⌄
Income Statement
Cash Flow
Balance Sheet
HEI Income Statement
Enable JavaScript and reload
Revenue, Net:
Cost of Goods & Services Sold:
Gross Profit:
Selling, General & Admin Expense:
Research & Development Expense:
Total Operating Expenses:
Operating Income:
Income Taxes:
Net Income:
HEI Cash Flow
Enable JavaScript and reload
Operating Activities Net Income:
Depreciation, Depletion & Amortization:
Change in Accounts Receiveable:
Net Cash from Operations:
Repurchases/Buybacks Common Stock:
Issuance of Long-term Debt:
Cash Dividends Paid:
Net Cash from Financing Activities:
Property, Plant & Equipment Purchases:
Purchases of Businesses, Net of Cash:
Net Cash from Investing Activities:
Net Change in Cash & Equivalents:
HEI Balance Sheet
Enable JavaScript and reload
Cash and Cash Equivalents:
Short-Term Investments:
Accounts Receivable, Net:
Inventories:
Total Current Assets:
Property, Plant & Equipment, Net:
Total Assets:
Accounts Payable:
Current Portion of Long-Term Debt:
Total Short-Term Liabilities:
Long Term Debt, Non-Current Portion:
Total Long-Term Liabilities:
Total Liabilities:
COMPANY PROFILE
Basis of Presentation
The Company has two operating segments: the Flight Support Group (“FSG”), consisting of HEICO Aerospace and HFSC and their respective subsidiaries; and the Electronic Technologies Group (“ETG”), consisting of HEICO Electronic and its subsidiaries.
The consolidated financial statements include the financial accounts of HEICO Corporation and its direct subsidiaries, all of which are wholly owned except for HEICO Aerospace, which is 20% owned by Lufthansa Technik AG ("LHT"), the technical services subsidiary of Lufthansa German Airlines. HFSC consolidates five subsidiaries which are 70%, 84%, 85%, 89% and 90%, owned, respectively, and seven subsidiaries that are each 80.1% owned. In addition, HEICO Aerospace consolidates a joint venture, which is 84% owned. HEICO Electronic consolidates four subsidiaries that are each 80.1% owned, two subsidiaries that are each 75% owned, and five subsidiaries which are 82.5%, 85%, 90%, 92.7% and 95.9% owned, respectively. Certain subsidiaries of HEICO Electronic consolidate subsidiaries that are less than wholly owned. See Note 13, Redeemable Noncontrolling Interests. All intercompany balances and transactions are eliminated.
The Company's results of operations in fiscal 2021 continued to reflect the adverse impact from the COVID-19 global pandemic (the “Pandemic”). Most notably, demand for HEICO's commercial aviation products and services were moderated by the ongoing depressed commercial aerospace market as compared to pre-Pandemic levels. The Company experienced a significant improvement in operating results in the second half of fiscal 2021 as compared to the second half of fiscal 2020. The second half of fiscal 2020 was the period in which the Company's results of operations were most negatively affected by the Pandemic’s impact. Since then, the FSG has reported five consecutive quarters of improvement in net sales and operating income resulting from signs of commercial air travel recovery.
Free historical financial statements for HEICO Corp.. See how revenue, income, cash flow, and balance sheet financials have changed over 62 quarters since 2011. Compare with HEI stock chart to see long term trends.
Data imported from HEICO Corp. SEC filings. Check original filings before making any investment decision.