Consumer Discretionary › Electric Housewares And Fans

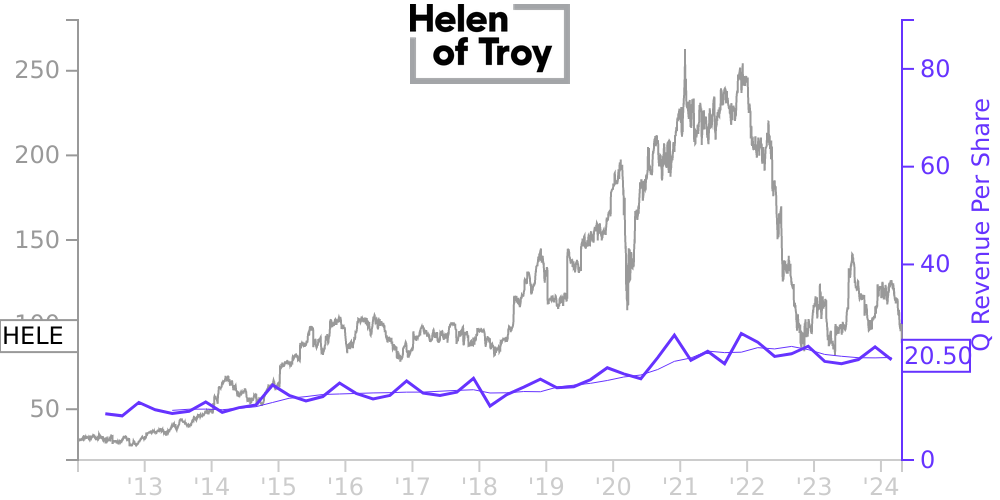
HELE Stock Price Correlated With Helen of Troy Financials
External Links ⌄
Income Statement
Cash Flow
Balance Sheet
HELE Income Statement
Enable JavaScript and reload
Revenue, Net:
Cost of Goods & Services Sold:
Gross Profit:
Selling, General & Admin Expense:
Research & Development Expense:
Total Operating Expenses:
Operating Income:
Income Taxes:
Net Income:
HELE Cash Flow
Enable JavaScript and reload
Operating Activities Net Income:
Depreciation, Depletion & Amortization:
Change in Accounts Receiveable:
Net Cash from Operations:
Repurchases/Buybacks Common Stock:
Issuance of Long-term Debt:
Cash Dividends Paid:
Net Cash from Financing Activities:
Property, Plant & Equipment Purchases:
Purchases of Businesses, Net of Cash:
Net Cash from Investing Activities:
Net Change in Cash & Equivalents:
HELE Balance Sheet
Enable JavaScript and reload
Cash and Cash Equivalents:
Short-Term Investments:
Accounts Receivable, Net:
Inventories:
Total Current Assets:
Property, Plant & Equipment, Net:
Total Assets:
Accounts Payable:
Current Portion of Long-Term Debt:
Total Short-Term Liabilities:
Long Term Debt, Non-Current Portion:
Total Long-Term Liabilities:
Total Liabilities:
COMPANY PROFILE
Note 1 - Basis of Presentation and Related Information
Corporate Overview
The accompanying condensed consolidated financial statements contain all adjustments (consisting of normal recurring adjustments) necessary to present fairly our consolidated financial position as of May 31, 2022 and February 28, 2022, and the results of our consolidated operations for the interim periods presented. We follow the same accounting policies when preparing quarterly financial data as we use for preparing annual data. These statements should be read in conjunction with the consolidated financial statements and the notes included in our latest annual report on Form 10-K for the fiscal year ended February 28, 2022 (“Form 10-K”), and our other reports on file with the Securities and Exchange Commission (the “SEC”).
When used in these notes, unless otherwise indicated or the context suggests otherwise, references to “the Company”, “our Company”, “Helen of Troy”, “we”, “us”, or “our” refer to Helen of Troy Limited and its subsidiaries, which are all wholly-owned. We refer to our common shares, par value $0.10 per share, as “common stock.” References to “the FASB” refer to the Financial Accounting Standards Board. References to “GAAP” refer to accounting principles generally accepted in the United States of America (the “U.S.”). References to “ASU” refer to the codification of GAAP in the Accounting Standards Updates issued by the FASB. References to “ASC” refer to the codification of GAAP in the Accounting Standards Codification issued by the FASB.
We incorporated as Helen of Troy Corporation in Texas in 1968 and were reorganized as Helen of Troy Limited in Bermuda in 1994. We are a leading consumer products company offering creative products and solutions for our customers through a diversified portfolio of brands. As of May 31, 2022, we operated three segments: Home & Outdoor, Health & Wellness, and Beauty. Our Home & Outdoor segment provides a broad range of innovative consumer products for home activities such as food preparation, cooking, cleaning and organization, as well as products for outdoor and on the go activities such as hydration, food storage, backpacks, and travel gear. The Health & Wellness segment provides health and wellness products including healthcare devices, thermometers, water and air filtration systems, humidifiers, and fans. Our Beauty segment provides mass and prestige market beauty appliances including hair styling appliances, grooming tools, decorative hair accessories, and prestige market liquid-based hair and personal care products.
Our business is seasonal due to different calendar events, holidays and seasonal weather patterns. Our fiscal reporting period ends on the last day in February. Historically, our highest sales volume and operating income occur in our third fiscal quarter ending November 30th. We purchase our products from unaffiliated manufacturers, most of which are located in China, Mexico, Vietnam and the U.S.
During the fourth quarter of fiscal 2020, we committed to a plan to divest certain assets within our Beauty segment's mass channel personal care business, which included liquid, powder and aerosol products under brands such as Pert, Brut, Sure and Infusium (“Personal Care”). On June 7, 2021, we completed the sale of our North America Personal Care business to HRB Brands LLC, for $44.7 million in cash and recognized a gain on the sale in SG&A totaling $0.5 million. On March 25, 2022, we completed the sale of the Latin America and Caribbean Personal Care business to HRB Brands LLC, for $1.8 million in cash and recognized a gain on the sale in SG&A totaling $1.3 million. See Note 3 for additional information.
On April 22, 2022, we completed the acquisition of Recipe Products Ltd., a producer of innovative prestige hair care products for all types of curly and wavy hair under the Curlsmith brand (“Curlsmith”). The total purchase consideration was $149.7 million in cash, net
Free historical financial statements for Helen of Troy Ltd. See how revenue, income, cash flow, and balance sheet financials have changed over 57 quarters since 2012. Compare with HELE stock chart to see long term trends.
Data imported from Helen of Troy Ltd SEC filings. Check original filings before making any investment decision.