Industrials › Ship And Boat Building And Repairing

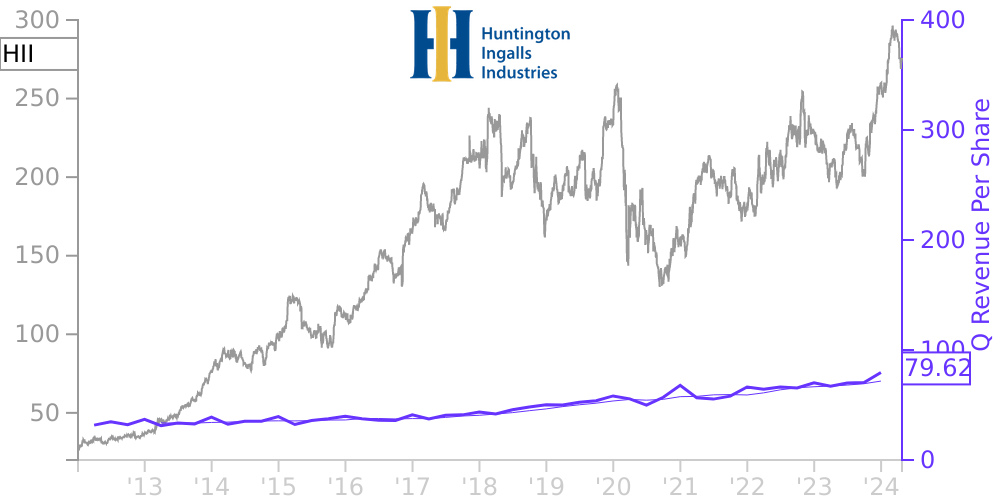
HII Stock Price Correlated With Huntington Ingalls Industries Financials
External Links ⌄
Income Statement
Cash Flow
Balance Sheet
HII Income Statement
Enable JavaScript and reload
Revenue, Net:
Cost of Goods & Services Sold:
Gross Profit:
Selling, General & Admin Expense:
Research & Development Expense:
Total Operating Expenses:
Operating Income:
Income Taxes:
Net Income:
HII Cash Flow
Enable JavaScript and reload
Operating Activities Net Income:
Depreciation, Depletion & Amortization:
Change in Accounts Receiveable:
Net Cash from Operations:
Repurchases/Buybacks Common Stock:
Issuance of Long-term Debt:
Cash Dividends Paid:
Net Cash from Financing Activities:
Property, Plant & Equipment Purchases:
Purchases of Businesses, Net of Cash:
Net Cash from Investing Activities:
Net Change in Cash & Equivalents:
HII Balance Sheet
Enable JavaScript and reload
Cash and Cash Equivalents:
Short-Term Investments:
Accounts Receivable, Net:
Inventories:
Total Current Assets:
Property, Plant & Equipment, Net:
Total Assets:
Accounts Payable:
Current Portion of Long-Term Debt:
Total Short-Term Liabilities:
Long Term Debt, Non-Current Portion:
Total Long-Term Liabilities:
Total Liabilities:
COMPANY PROFILE
BASIS OF PRESENTATION Principles of Consolidation - The unaudited condensed consolidated financial statements of HII and its subsidiaries have been prepared in conformity with accounting principles generally accepted in the United States of America ("GAAP") and the instructions to Form 10-Q promulgated by the Securities and Exchange Commission ("SEC"). All intercompany transactions and balances are eliminated in consolidation. For classification of current assets and liabilities related to its long-term production contracts, the Company uses the duration of these contracts as its operating cycle, which is generally longer than one year.
These unaudited condensed consolidated financial statements include all adjustments of a normal recurring nature considered necessary by management for a fair presentation of the unaudited condensed consolidated financial position, results of operations, and cash flows and should be read in conjunction with the Company's audited consolidated financial statements included in the Company's Annual Report on Form 10-K for the year ended December 31, 2021.
The quarterly information is labeled using a calendar convention; that is, first quarter is consistently labeled as ending on March 31, second quarter as ending on June 30, and third quarter as ending on September 30. It is management's long-standing practice to establish interim closing dates using a "fiscal" calendar, which requires the businesses to close their books on a Friday near these quarter-end dates in order to normalize the potentially disruptive effects of quarterly closings on business processes. The effects of this practice only exist for interim periods within a reporting year.
Accounting Estimates - The preparation of the Company's unaudited condensed consolidated financial statements requires management to make estimates and judgments that affect the reported amounts of assets and liabilities and the disclosure of contingencies at the date of the financial statements, as well as the reported amounts of revenues and expenses during the reporting period. Estimates have been prepared on the basis of the most current and best available information, and actual results could differ materially from those estimates.
Fair Value of Financial Instruments - Except for the Company's long-term debt, the carrying amounts of the Company's financial instruments recorded at historical cost approximate fair value due to the short-term nature of the instruments and low credit risk associated with the respective counterparties.
The Company maintains multiple grantor trusts to fund certain non-qualified pension plans. These trusts were valued at $216 million and $220 million as of March 31, 2022, and December 31, 2021, respectively, and are
presented within miscellaneous other assets within the unaudited condensed consolidated statements of financial position. These trusts consist primarily of investments in marketable securities, which are held at fair value within Level 1 of the fair value hierarchy.
The estimated fair values of the Company's total long-term debt as of March 31, 2022, and December 31, 2021, were $3,184 million and $3,449 million, respectively. The fair values of the Company's long-term debt were calculated based on recent trades of the Company's debt instruments in inactive markets, which fall within Level 2 under the fair value hierarchy.
Debt Prepayment - For the three months ended March 31, 2022, the Company prepaid $100 million of long-term debt related to its Term Loan due August 19, 2024.
Free historical financial statements for Huntington Ingalls Industries Inc. See how revenue, income, cash flow, and balance sheet financials have changed over 57 quarters since 2012. Compare with HII stock chart to see long term trends.
Data imported from Huntington Ingalls Industries Inc SEC filings. Check original filings before making any investment decision.