Industrials › Office Furniture (No Wood)

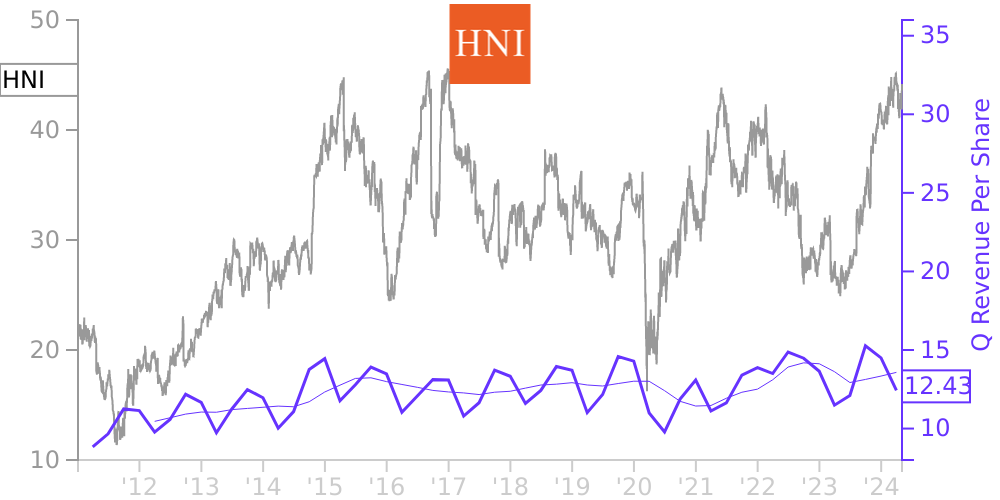
HNI Stock Price Correlated With HNI Financials
External Links ⌄
Income Statement
Cash Flow
Balance Sheet
HNI Income Statement
Enable JavaScript and reload
Revenue, Net:
Cost of Goods & Services Sold:
Gross Profit:
Selling, General & Admin Expense:
Research & Development Expense:
Total Operating Expenses:
Operating Income:
Income Taxes:
Net Income:
HNI Cash Flow
Enable JavaScript and reload
Operating Activities Net Income:
Depreciation, Depletion & Amortization:
Change in Accounts Receiveable:
Net Cash from Operations:
Repurchases/Buybacks Common Stock:
Issuance of Long-term Debt:
Cash Dividends Paid:
Net Cash from Financing Activities:
Property, Plant & Equipment Purchases:
Purchases of Businesses, Net of Cash:
Net Cash from Investing Activities:
Net Change in Cash & Equivalents:
HNI Balance Sheet
Enable JavaScript and reload
Cash and Cash Equivalents:
Short-Term Investments:
Accounts Receivable, Net:
Inventories:
Total Current Assets:
Property, Plant & Equipment, Net:
Total Assets:
Accounts Payable:
Current Portion of Long-Term Debt:
Total Short-Term Liabilities:
Long Term Debt, Non-Current Portion:
Total Long-Term Liabilities:
Total Liabilities:
COMPANY PROFILE
Nature of Operations HNI Corporation with its subsidiaries (the "Corporation") is a provider of workplace furnishings and residential building products. Refer to "Note 16. Reportable Segment Information" in the Notes to Consolidated Financial Statements for further information. Workplace furnishings products include panel-based and freestanding furniture systems, seating, storage, tables, and architectural products. These products are sold primarily through a national system of independent dealers, wholesalers, and office product distributors but also directly to end-user customers and federal, state, and local governments. Residential building products include a full array of gas, wood, electric, and pellet fueled fireplaces, inserts, stoves, facings, and accessories. These products are sold through a national system of independent dealers and distributors, as well as Corporation-owned distribution and retail outlets. The Corporation’s products are marketed predominantly in the United States and Canada. The Corporation exports select products through its export subsidiary to a limited number of markets outside North America, principally the Middle East, Mexico, Latin America, and the Caribbean. The Corporation also manufactures and markets office furniture in Asia, primarily China and India.
Fiscal year-end – The Corporation follows a 52/53-week fiscal year, which ends on the Saturday nearest December 31. Fiscal year 2021 ended on January 1, 2022, fiscal year 2020 ended on January 2, 2021, and fiscal year 2019 ended on December 28, 2019. The financial statements for fiscal years 2021 and 2019 are on a 52-week basis, while 2020 is on a 53-week basis. A 53-week year occurs approximately every sixth year.
Fiscal year-end – The Corporation follows a 52/53-week fiscal year, which ends on the Saturday nearest December 31. Fiscal year 2021 ended on January 1, 2022, fiscal year 2020 ended on January 2, 2021, and fiscal year 2019 ended on December 28, 2019. The financial statements for fiscal years 2021 and 2019 are on a 52-week basis, while 2020 is on a 53-week basis. A 53-week year occurs approximately every sixth year.
Free historical financial statements for Hni Corp. See how revenue, income, cash flow, and balance sheet financials have changed over 61 quarters since 2011. Compare with HNI stock chart to see long term trends.
Data imported from Hni Corp SEC filings. Check original filings before making any investment decision.