Industrials › Motor Vehicle Parts And Accessories

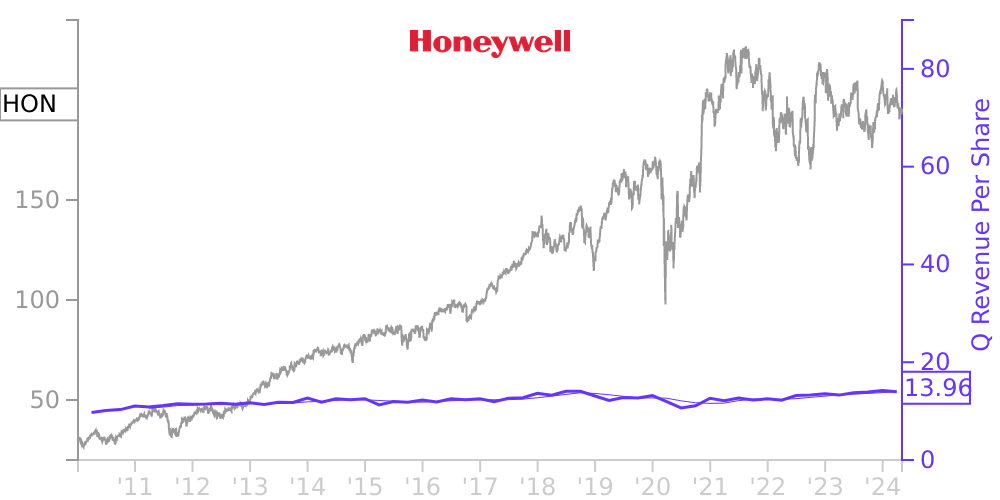
HON Stock Price Correlated With Honeywell International Financials
External Links ⌄
Income Statement
Cash Flow
Balance Sheet
HON Income Statement
Enable JavaScript and reload
Revenue, Net:
Cost of Goods & Services Sold:
Gross Profit:
Selling, General & Admin Expense:
Research & Development Expense:
Total Operating Expenses:
Operating Income:
Income Taxes:
Net Income:
HON Cash Flow
Enable JavaScript and reload
Operating Activities Net Income:
Depreciation, Depletion & Amortization:
Change in Accounts Receiveable:
Net Cash from Operations:
Repurchases/Buybacks Common Stock:
Issuance of Long-term Debt:
Cash Dividends Paid:
Net Cash from Financing Activities:
Property, Plant & Equipment Purchases:
Purchases of Businesses, Net of Cash:
Net Cash from Investing Activities:
Net Change in Cash & Equivalents:
HON Balance Sheet
Enable JavaScript and reload
Cash and Cash Equivalents:
Short-Term Investments:
Accounts Receivable, Net:
Inventories:
Total Current Assets:
Property, Plant & Equipment, Net:
Total Assets:
Accounts Payable:
Current Portion of Long-Term Debt:
Total Short-Term Liabilities:
Long Term Debt, Non-Current Portion:
Total Long-Term Liabilities:
Total Liabilities:
COMPANY PROFILE
NOTE 1. Basis of Presentation
In the opinion of management, the accompanying unaudited consolidated financial statements reflect all adjustments, consisting only of normal recurring adjustments, necessary to present fairly the financial position of Honeywell International Inc. and its consolidated subsidiaries at March 31, 2010 and the results of operations for the three months ended March 31, 2010 and 2009 and cash flows for the three months ended March 31, 2010 and 2009. The results of operations for the three month period ended March 31, 2010 should not necessarily be taken as indicative of the results of operations that may be expected for the entire year. We have evaluated subsequent events through the date of issuance of our consolidated financial statements.
We report our quarterly financial information using a calendar convention; that is, the first, second and third quarters are consistently reported as ending on March 31, June 30 and September 30, respectively. It has been our practice to establish actual quarterly closing dates using a predetermined “fiscal” calendar, which requires our businesses to close their books on a Saturday in order to minimize the potentially disruptive effects of quarterly closing on our business processes. The effects of this practice are generally not significant to reported results for any quarter and only exist within a reporting year. In the event that differences in actual closing dates are material to year-over-year comparisons of quarterly or year-to-date results, we provide appropriate disclosures. Our actual closing dates for the three month periods ended March 31, 2010 and 2009 were April 3, 2010 and April 4, 2009, respectively.
The financial information as of March 31, 2010 should be read in conjunction with the financial statements for the year ended December 31, 2009 contained in our Form 10-K filed on February 12, 2010.
Certain prior year amounts have been reclassified to conform to current year presentation.
Free historical financial statements for Honeywell International Inc. See how revenue, income, cash flow, and balance sheet financials have changed over 65 quarters since 2010. Compare with HON stock chart to see long term trends.
Data imported from Honeywell International Inc SEC filings. Check original filings before making any investment decision.