Industrials › Services-Help Supply Services
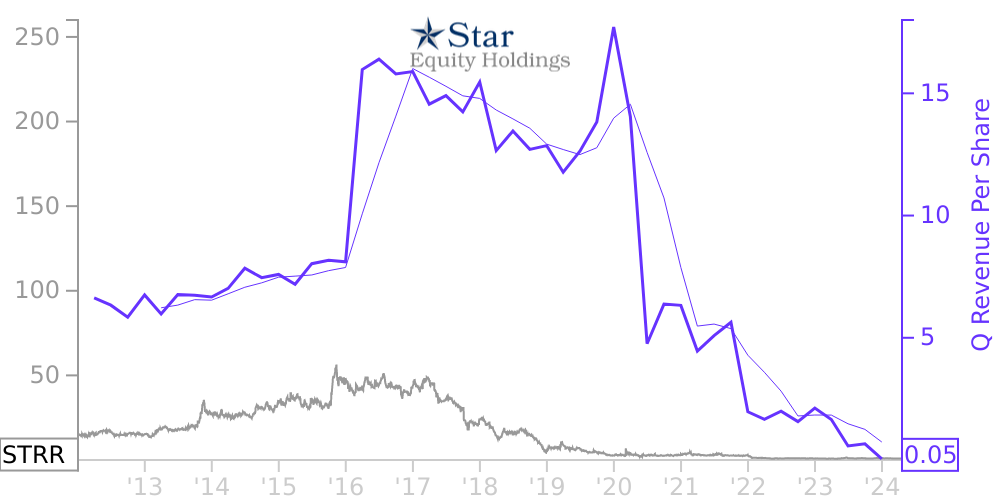
STRR Stock Price Correlated With Star Equity Holdings, Inc. Financials
External Links ⌄
Income Statement
Cash Flow
Balance Sheet
STRR Income Statement
Enable JavaScript and reload
Revenue, Net:
Cost of Goods & Services Sold:
Gross Profit:
Selling, General & Admin Expense:
Research & Development Expense:
Total Operating Expenses:
Operating Income:
Income Taxes:
Net Income:
STRR Cash Flow
Enable JavaScript and reload
Operating Activities Net Income:
Depreciation, Depletion & Amortization:
Change in Accounts Receiveable:
Net Cash from Operations:
Repurchases/Buybacks Common Stock:
Issuance of Long-term Debt:
Cash Dividends Paid:
Net Cash from Financing Activities:
Property, Plant & Equipment Purchases:
Purchases of Businesses, Net of Cash:
Net Cash from Investing Activities:
Net Change in Cash & Equivalents:
STRR Balance Sheet
Enable JavaScript and reload
Cash and Cash Equivalents:
Short-Term Investments:
Accounts Receivable, Net:
Inventories:
Total Current Assets:
Property, Plant & Equipment, Net:
Total Assets:
Accounts Payable:
Current Portion of Long-Term Debt:
Total Short-Term Liabilities:
Long Term Debt, Non-Current Portion:
Total Long-Term Liabilities:
Total Liabilities:
COMPANY PROFILE
BASIS OF PRESENTATION These interim unaudited condensed consolidated financial statements have been prepared in accordance with United States of America (“U.S.”) generally accepted accounting principles (“U.S. GAAP”) for interim financial information and with the instructions to Form 10-Q and Article 8 of Regulation S-X of the United States Securities and Exchange Commission (“SEC”) for interim financial reporting and should be read in conjunction with the consolidated financial statements and related notes of Hudson Global, Inc. and its subsidiaries (the “Company”) filed in its Annual Report on Form 10-K for the year ended December 31, 2021.
The preparation of financial statements in conformity with U.S. GAAP requires management to make estimates and assumptions that affect the reported amounts of assets and liabilities, the disclosure of contingent assets and liabilities, and the reported amounts of operating revenues and expenses. These estimates are based on management’s knowledge and judgments. In the opinion of management, all adjustments (consisting of normal recurring adjustments) considered necessary for a fair presentation of the Company’s financial position, results of operations, and cash flows at the dates and for the periods presented have been included. The results of operations for interim periods are not necessarily indicative of the results of operations for the full year. The condensed consolidated financial statements include the accounts of the Company and all of its wholly owned subsidiaries. Intra-entity balances and transactions between and among the Company and its subsidiaries have been eliminated in consolidation. Certain prior period amounts have been reclassified to conform to the current year presentation with no material impact on the condensed consolidated financial statements. For more information, see Note 2 to the Condensed Consolidated Financial Statements.
The preparation of financial statements in conformity with U.S. GAAP requires management to make estimates and assumptions that affect the reported amounts of assets and liabilities, the disclosure of contingent assets and liabilities, and the reported amounts of operating revenues and expenses. These estimates are based on management’s knowledge and judgments. In the opinion of management, all adjustments (consisting of normal recurring adjustments) considered necessary for a fair presentation of the Company’s financial position, results of operations, and cash flows at the dates and for the periods presented have been included. The results of operations for interim periods are not necessarily indicative of the results of operations for the full year. The condensed consolidated financial statements include the accounts of the Company and all of its wholly owned subsidiaries. Intra-entity balances and transactions between and among the Company and its subsidiaries have been eliminated in consolidation. Certain prior period amounts have been reclassified to conform to the current year presentation with no material impact on the condensed consolidated financial statements. For more information, see Note 2 to the Condensed Consolidated Financial Statements.
Free historical financial statements for Star Equity Holdings. See how revenue, income, cash flow, and balance sheet financials have changed over 54 quarters since 2012. Compare with STRR stock chart to see long term trends.
Data imported from Star Equity Holdings SEC filings. Check original filings before making any investment decision.