
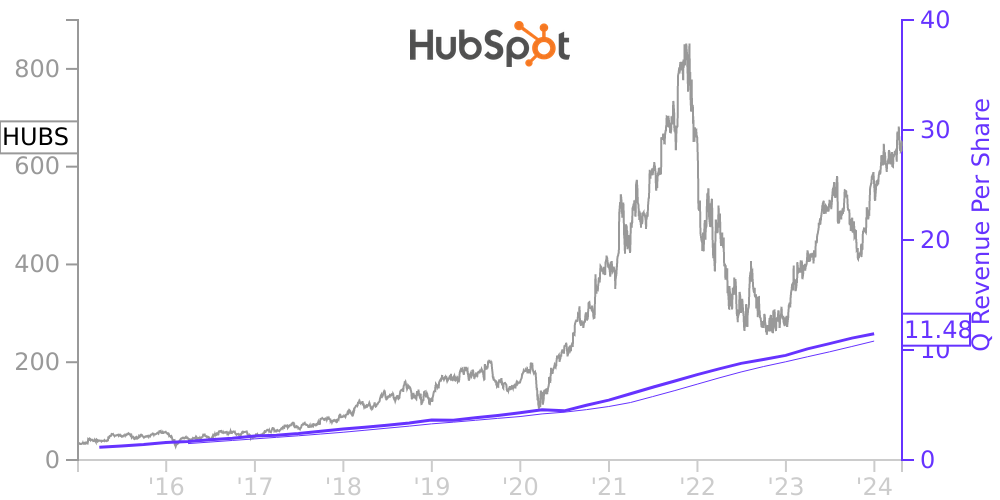
HUBS Stock Price Correlated With HubSpot Financials
External Links ⌄
Income Statement
Cash Flow
Balance Sheet
HUBS Income Statement
Enable JavaScript and reload
Revenue, Net:
Cost of Goods & Services Sold:
Gross Profit:
Selling, General & Admin Expense:
Research & Development Expense:
Total Operating Expenses:
Operating Income:
Income Taxes:
Net Income:
HUBS Cash Flow
Enable JavaScript and reload
Operating Activities Net Income:
Depreciation, Depletion & Amortization:
Change in Accounts Receiveable:
Net Cash from Operations:
Repurchases/Buybacks Common Stock:
Issuance of Long-term Debt:
Cash Dividends Paid:
Net Cash from Financing Activities:
Property, Plant & Equipment Purchases:
Purchases of Businesses, Net of Cash:
Net Cash from Investing Activities:
Net Change in Cash & Equivalents:
HUBS Balance Sheet
Enable JavaScript and reload
Cash and Cash Equivalents:
Short-Term Investments:
Accounts Receivable, Net:
Inventories:
Total Current Assets:
Property, Plant & Equipment, Net:
Total Assets:
Accounts Payable:
Current Portion of Long-Term Debt:
Total Short-Term Liabilities:
Long Term Debt, Non-Current Portion:
Total Long-Term Liabilities:
Total Liabilities:
COMPANY PROFILE
1. Organization and Operations HubSpot, Inc. (the “Company”) provides a cloud-based CRM Platform, that enables companies to attract, engage, and delight customers throughout the customer experience. The Company’s CRM Platform, comprised of Marketing Hub, Sales Hub, Service Hub, CMS Hub, and Operations Hub features integrated applications, tools, and a native payment solution, that enable businesses to create a cohesive and adaptable customer experience.
Free historical financial statements for HubSpot Inc.. See how revenue, income, cash flow, and balance sheet financials have changed over 45 quarters since 2015. Compare with HUBS stock chart to see long term trends.
Data imported from HubSpot Inc. SEC filings. Check original filings before making any investment decision.